Shopify Analytics Dashboard: Stop Switching Between Tabs
August 24, 2026
·
Tim Liu
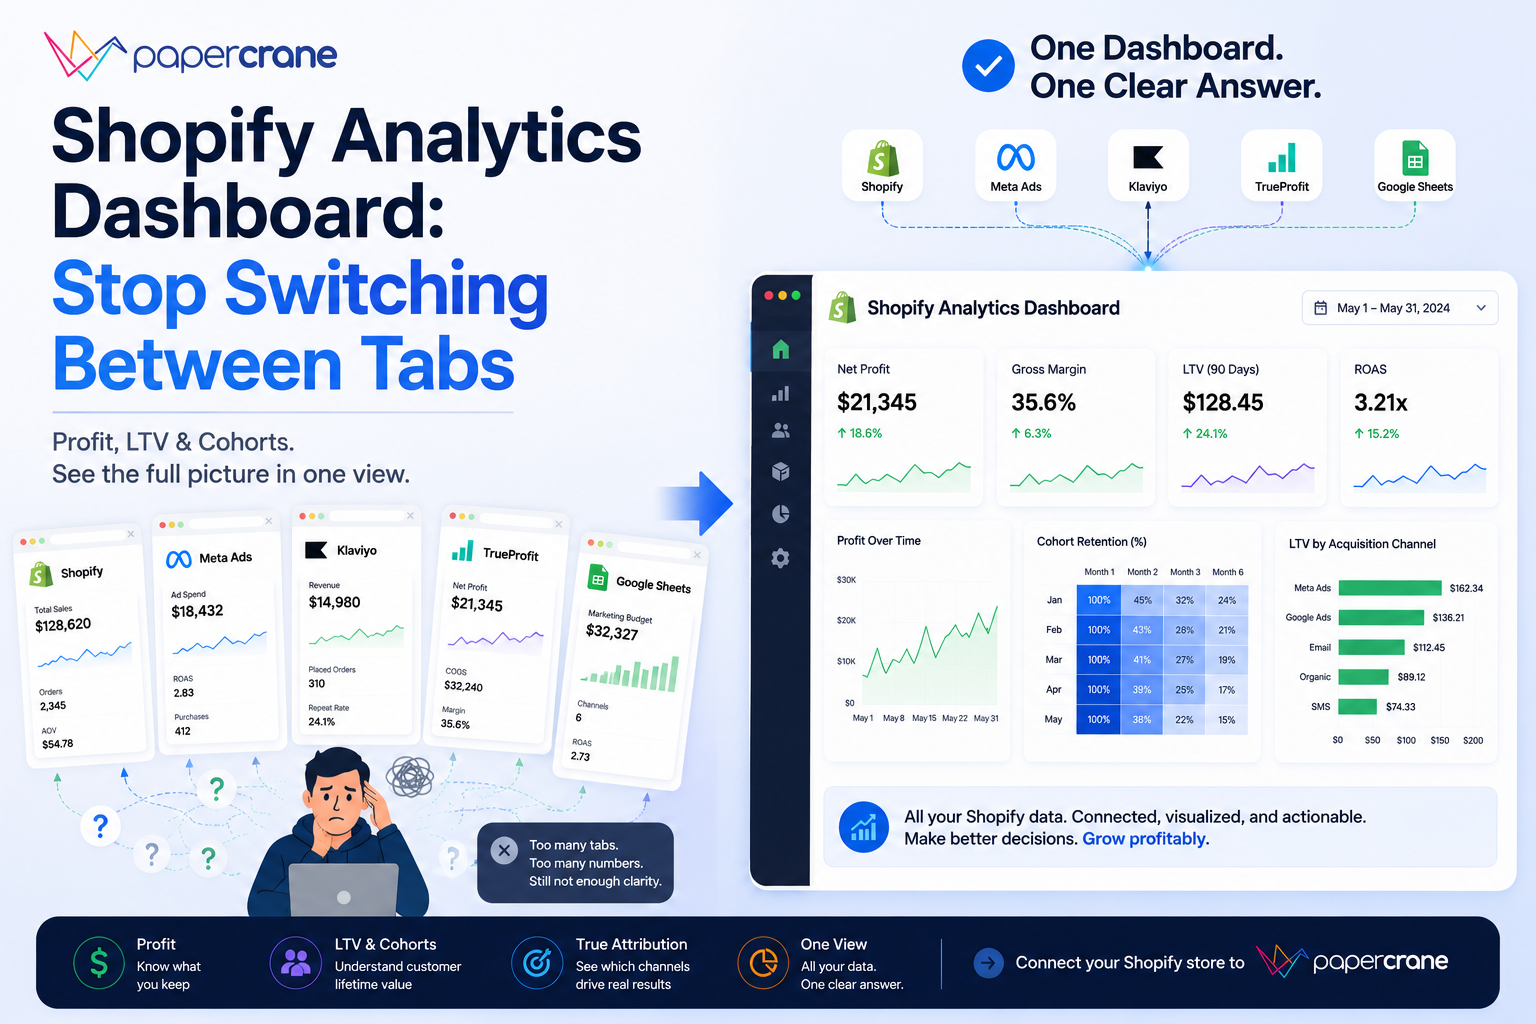
You open your Shopify analytics dashboard to track your store’s sales, traffic, and orders to get a read on last week. Revenue looks decent. You feel cautiously okay.
Then you open Meta Ads Manager to check your ad performance. Then Klaviyo to see what email brought in. Then your profit tracking app. Forty-five minutes later, the numbers across all four tabs don’t agree, and you still can’t answer the one question that actually matters:
Did last week make us money?
This is not a data problem. You have more data than ever. This is a Shopify reporting problem. Your data lives in five different places, and nothing connects it into one clear answer.
What Can You Measure in Shopify Analytics?
To be fair, your Shopify dashboard does its job. Every morning you can open it and see your total sales, number of orders, average order value, conversion rate, and how many returning customers you had. For a quick health check, it works.
The problem starts when merchants treat it as their only source of truth, and then open four more tabs to fill in what’s missing.
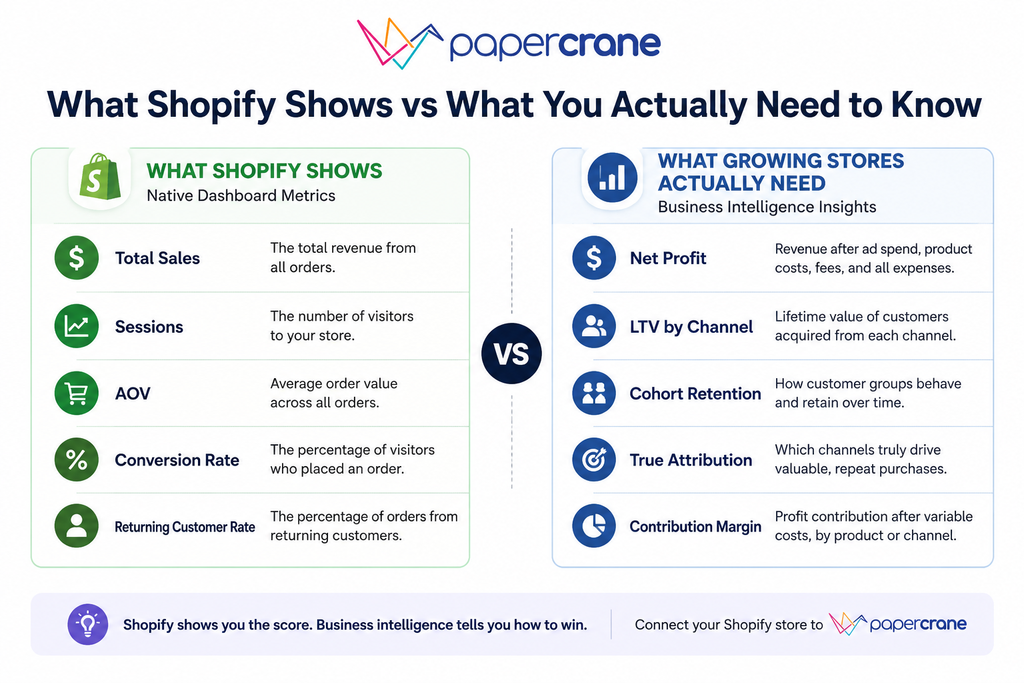
Your Shopify sales dashboard gives you metrics such as:
- Total sales
- Orders
- Average order value
- Conversion rate
- Returning customer rate
But you still need other data to answer questions such as:
- What was our actual profit after product costs, ad spend and fees?
- Which acquisition channel brings customers with the highest LTV?
- How does retention differ between customer cohorts?
- Which channels are driving profitable revenue?
Shopify gives you a useful view of store performance. The harder questions require data from outside Shopify.
Connect your Shopify store to PaperCrane to see what your dashboard is leaving out.
What Is The Real Shopify Reporting Problem?
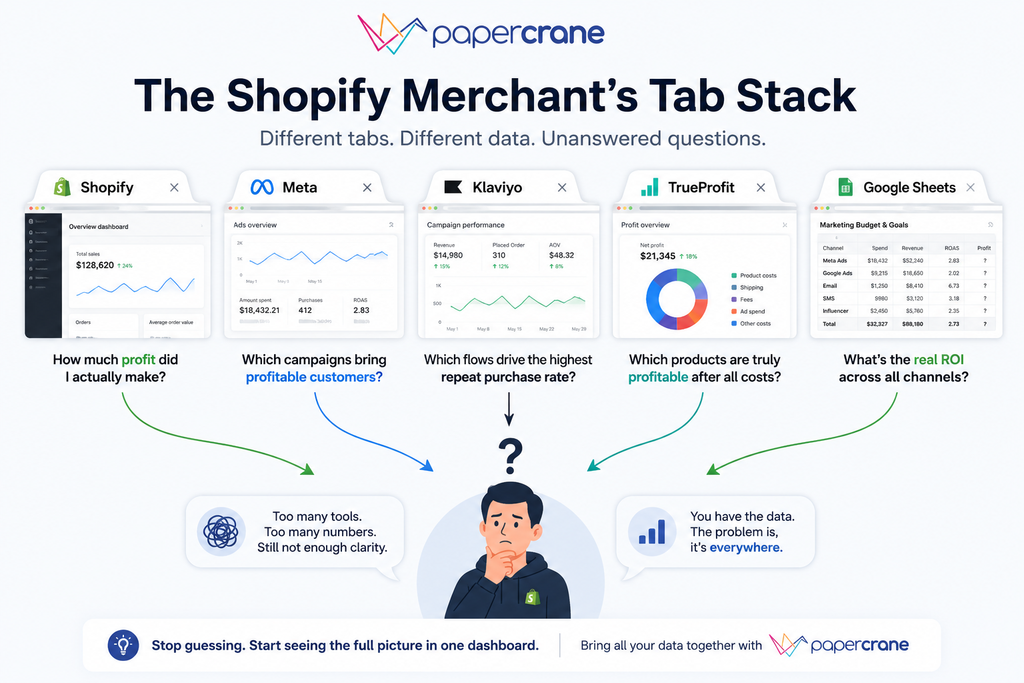
Here’s what most Shopify merchants actually have open when they sit down to review their numbers:
| Tab Open | What You’re Looking For | Why It Still Doesn’t Answer It |
|---|---|---|
| Shopify Analytics | Revenue, orders, traffic | No true profit, no LTV, no cross-channel view |
| Meta Ads Manager | Which ads are working | Shows Meta-attributed sales only, inflates ROAS, misses everything else |
| Klaviyo | What email revenue brought in | Completely siloed, can’t compare email LTV to paid channel LTV |
| TrueProfit or BeProfit | Actual profit after costs | Separate login, separate dashboard, still no picture of which customers came back |
| Google Sheet | “My real numbers” | Manual, already outdated, breaks every time something changes |
Each of these tools was built to answer its own question. Not one of them was built to talk to the others.
So who ends up doing the connecting? You do. In your head. On a Sunday evening. Imperfectly.
You end up making spend decisions based on whichever tab you happened to check last. You increase Meta budget because Meta says it’s working, but Meta only counts its own conversions.
Your Shopify dashboard shows revenue but not profit. Your profit app shows profit but not which products or channels drove it. And your Google Sheet is already a week behind.
This is why according to the 2025 State of Marketing Attribution research, nearly half of retail marketing spend is estimated to be wasted. It’s because the data they’re making decisions on is fragmented and disconnected.
You have more data than you did at $5K/month. You have less clarity.
What Happens When All Your Shopify Data Lives in One Place
Imagine this instead.
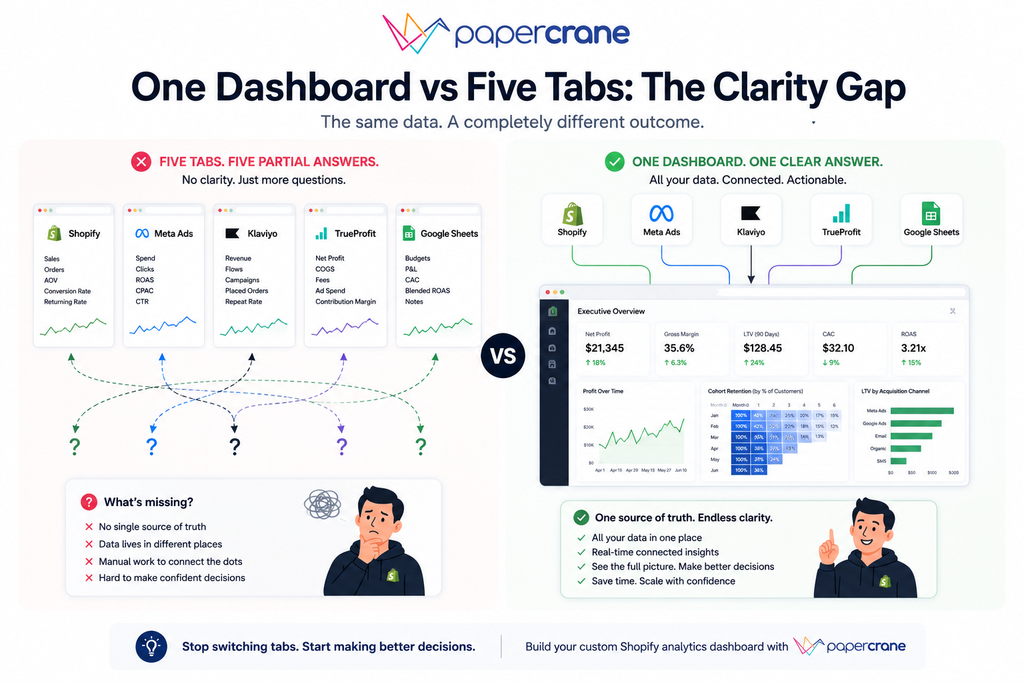
You open one dashboard. Your Shopify revenue is there. Your Meta ad spend is there. Your email revenue is there. Your net profit, after product costs, fees, and ad spend is there. You don’t switch tabs. You don’t manually combine anything. You just see the full picture.
That’s what a proper custom Shopify dashboard actually looks like.
Here’s what becomes possible when everything connects:
You want to know if last month’s Meta campaign was actually profitable. Not just whether it drove sales, but whether those sales covered the ad spend, the cost of goods, and Shopify’s fees. You see it in under ten seconds, without opening a single other tab.
You want to know which channel brings customers who buy more than once. Email, paid social, organic search, which one produced buyers who came back in 60 days? You see a cohort breakdown without exporting a CSV or building a pivot table.
You want your weekly numbers before Monday’s standup. Not three hours into it.
A unified Shopify KPI dashboard tracks all of this in one view:
- Net profit after product costs, transaction fees, ad spend, and returns
- Customer lifetime value broken down by where those customers came from
- Cohort retention, which month’s buyers actually came back, and which didn’t
- Channel ROAS in the context of real profit, not just revenue numbers
This is what your Shopify profit dashboard should look like, not five separate tools you manually stitch together every week.
Build your custom Shopify analytics dashboard with PaperCrane and see all your data in one place.
How PaperCrane Turns Your Shopify Data Into One Decision-Ready Dashboard
PaperCrane is an AI dashboard builder designed for exactly this problem. Here’s what it does differently:
Connect once, see everything. You link your Shopify store, your ad platforms, and your email tool one time. After that, your data pulls together automatically. No more tab switching, no more manual exports, no more Sunday night spreadsheet sessions.
Ask questions in plain English. Instead of building reports or writing queries, you just ask:
“What was my net profit last month by channel?” or “Which product has the highest returning customer rate?” You get an answer immediately.
This is what sets an AI-powered approach apart from just connecting a few apps, it doesn’t just show you data, it helps you understand it. Learn more about how the AI-powered dashboard builder works.
Profit, LTV, and cohorts from day one. These are the metrics that either require a Shopify Advanced plan ($299/month) or three separate apps to see. With PaperCrane, they’re part of your dashboard from the moment you connect. And if you’re also using Stripe, you can connect Stripe for complete revenue tracking alongside your Shopify data.
Shopify’s native analytics is a solid foundation. PaperCrane is what you build on top of it.
Shopify Analytics Dashboard: Common Questions Answered
Why don’t my Shopify and Meta numbers match?
Shopify tracks sales using its own session-based, last-click method. Meta tracks using its pixel and attributes conversions differently. They’re measuring different things. A unified dashboard brings both into one view so you can see actual performance without choosing which number to believe.
Can I see profit in my Shopify dashboard?
Not on Basic or Standard plans. The profit-by-product report is locked behind Shopify Advanced ($299/month) and Plus. Even then, it only shows product-level gross profit, not true net profit after ad spend, fees, and returns.
What is LTV in Shopify analytics?
Shopify shows a basic predicted lifetime value for your customers as a whole. It doesn’t break it down by channel, product, or acquisition period. To know whether your Meta buyers are worth more over 12 months than your email buyers, you need a separate tool or a custom dashboard.
How do I stop switching between multiple dashboards?
Connect your Shopify store, ad platforms, and email tool to a single unified analytics dashboard. When all your sources feed into one place automatically, you stop manually reconciling numbers across tabs.
What should a Shopify KPI dashboard actually include?
At minimum: net profit, LTV by acquisition channel, cohort retention rate, conversion rate, average order value, and ROAS in a profit context, not just revenue. If you can’t see all of these in one place, you’re working with an incomplete picture.
Your Shopify analytics dashboard is a good starting point. But growing a store on it alone is like navigating with half a map.
The merchants who scale without burning out aren’t the ones with more tools, they’re the ones who stopped switching tabs and started asking better questions in one place. You don’t need another dashboard. You need one that actually has all the answers.