AI Dashboard Builder: Create Dashboards Without SQL or Analysts
July 9, 2026
·
Tim Liu
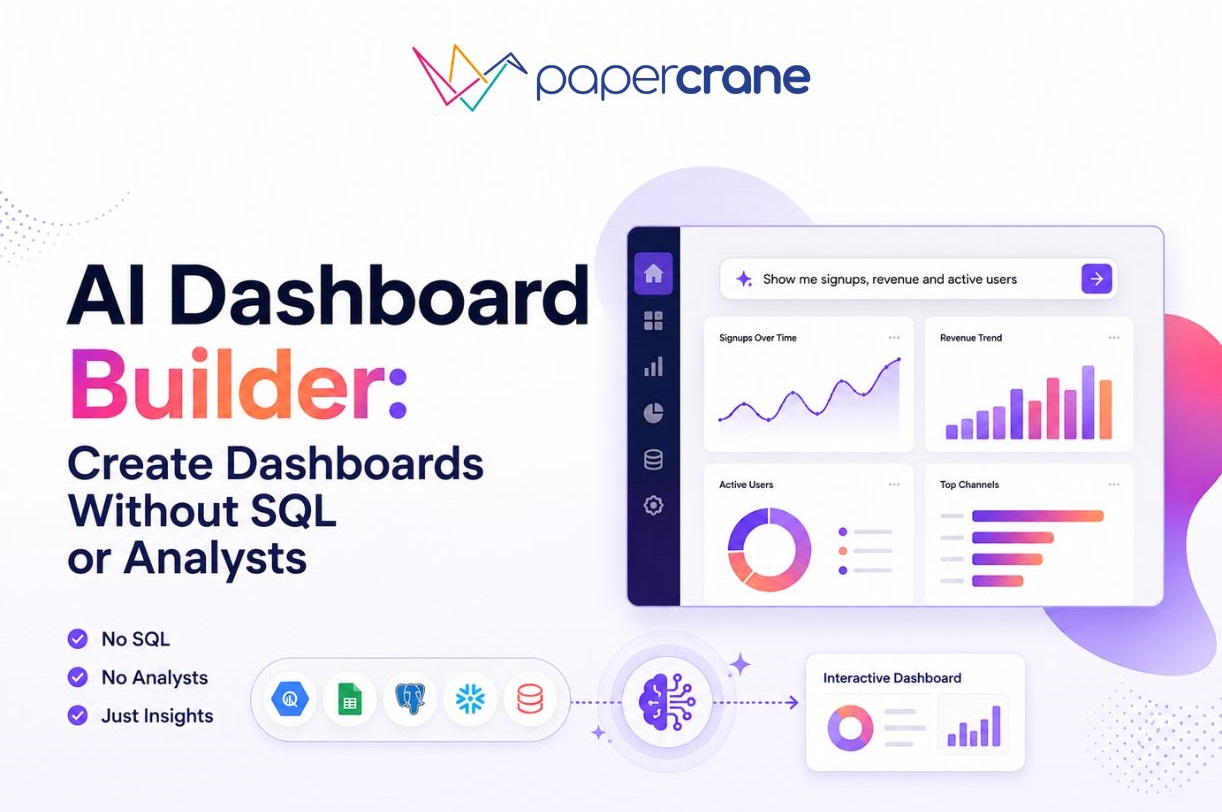
Businesses rely on dashboards to track revenue, marketing performance, customer behavior, product usage, and key performance indicators.
The problem is that building those dashboards has traditionally required analysts, SQL queries, business intelligence tools, and significant setup time.
A simple reporting request often turns into days of work involving multiple people.
Today, AI-powered dashboards builders are changing that process.
Instead of writing SQL queries or manually configuring reports, users can connect their data, describe what they want to see, and let AI generate dashboards automatically.
This makes analytics more accessible to teams that do not have dedicated analysts or technical resources.
Can AI Build Dashboards?
Yes. Modern AI dashboard builders can connect to data sources such as Google Analytics 4, BigQuery, HubSpot, PostgreSQL, Snowflake, and CRM platforms.
They understand natural language prompts and generate dashboards automatically without requiring SQL knowledge, manual reporting, or business intelligence expertise.
For example, instead of asking an analyst to create a sales dashboard, you can simply ask:
“Show monthly revenue, top-performing products, and sales by region.”
The AI generates the dashboard based on your connected data. Users can then refine the dashboard, ask follow-up questions, or share insights without rebuilding reports from scratch.
Why Traditional Dashboard Creation Is Slow
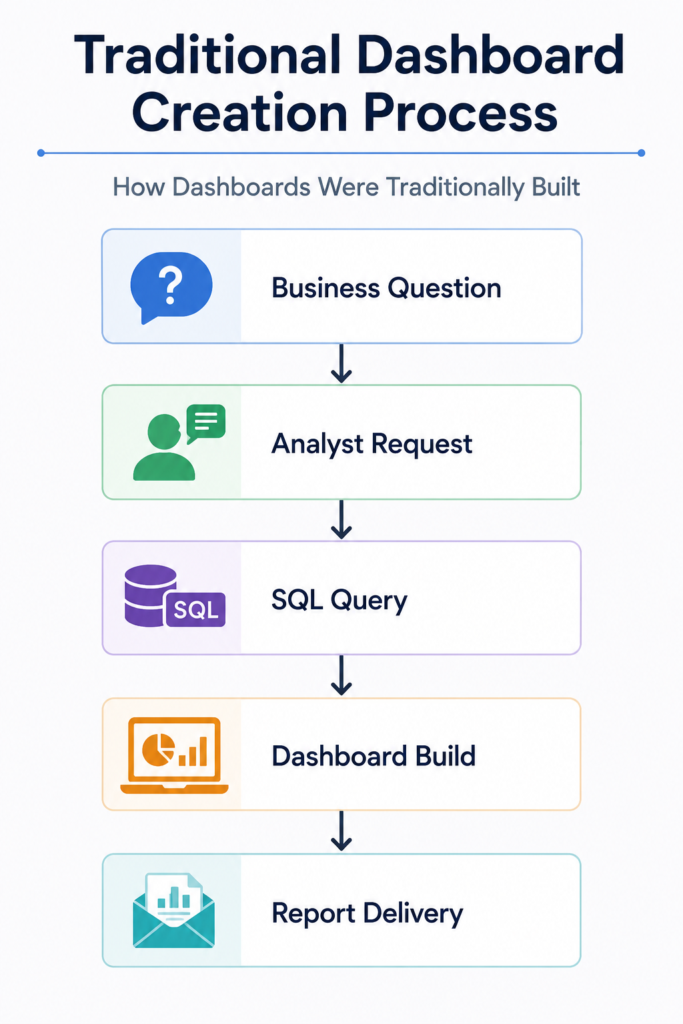
Before AI-powered analytics, creating a dashboard usually followed the same process.
A manager needed insights.
The request was sent to an analyst.
The analyst wrote SQL queries, gathered data, built reports in tools such as Tableau or Power BI, and shared the results.
This process created several challenges:
- Reporting delays
- Dependence on analysts
- Technical bottlenecks
- Higher reporting costs
- Limited access to data
As organizations grow, these challenges become even more noticeable.
Every new dashboard request adds more work for data teams.
How AI Dashboard Builders Work
AI dashboard builders simplify the entire process
Instead of relying on analysts, SQL queries, and manual reporting workflows, users interact with analytics through natural language.
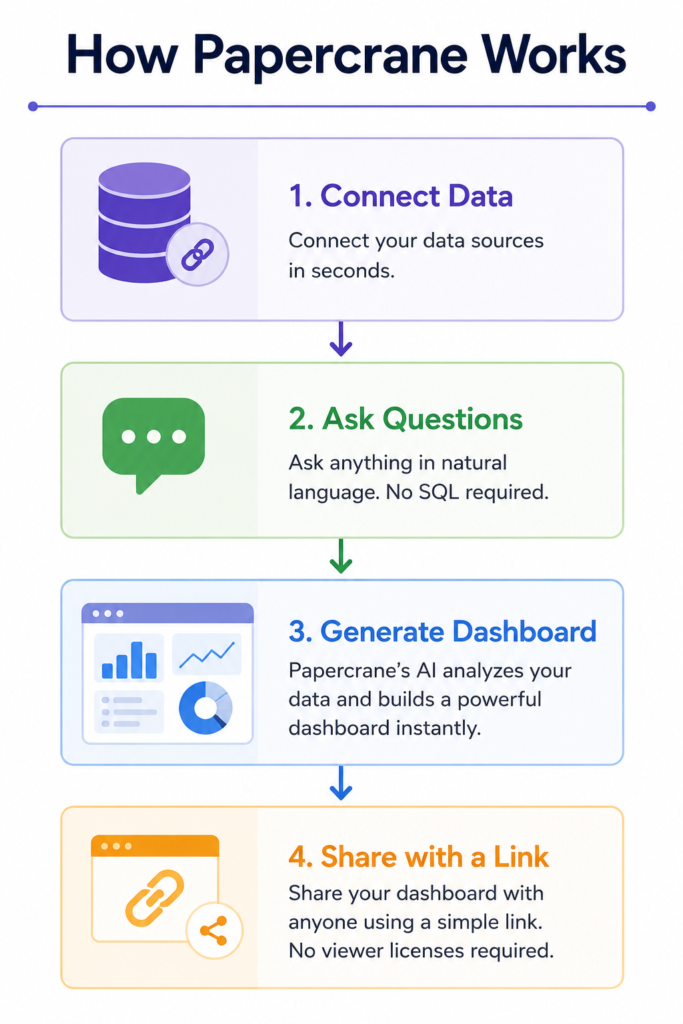
The process usually looks like this:
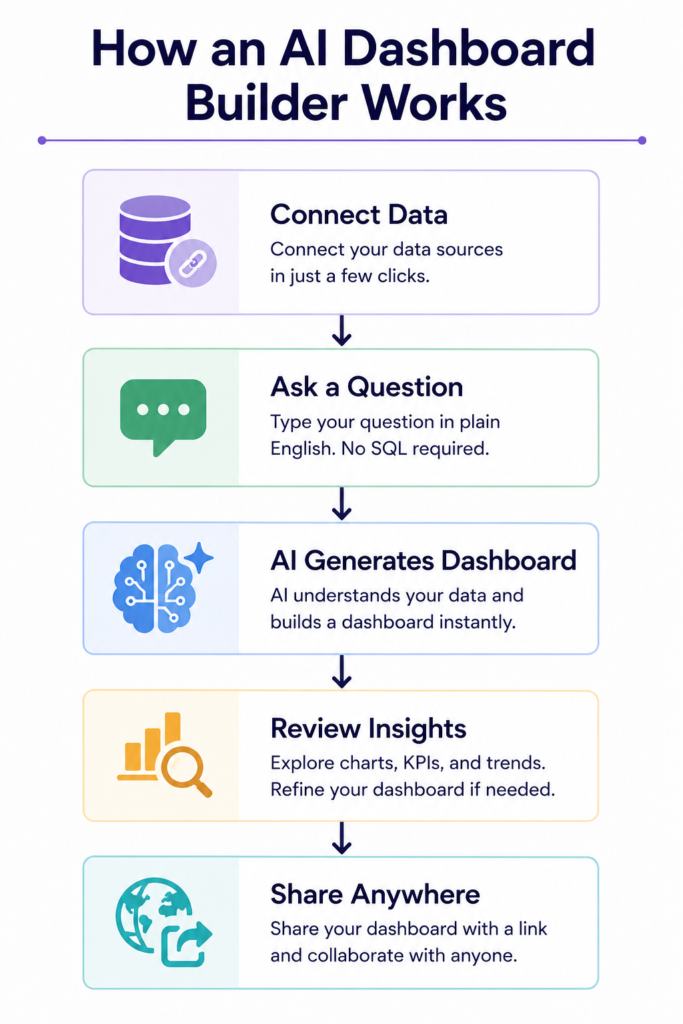
Step 1: Connect Your Data
Start by connecting the data sources you already use.
Common examples include:
- Google Analytics 4
- HubSpot
- BigQuery
- PostgreSQL
- Snowflake
- CRM platforms
Once connected, the AI can access and understand your data structure.
Step 2: Describe What You Want to See
Instead of writing SQL, users simply type a request.
Examples:
- Show monthly recurring revenue
- Compare sales by region
- Track customer acquisition trends
- Display website traffic by source
The AI interprets the request and determines which data should be included.
Step 3: Generate the Dashboard
The AI automatically creates charts, visualizations, KPIs, and reports based on the request.
This removes much of the manual work traditionally required to build dashboards.
Step 4: Refine and Share
Users can make adjustments, add metrics, or ask follow-up questions.
Once complete, dashboards can be shared across teams, clients, or stakeholders.
Benefits of Using AI to Build Dashboards
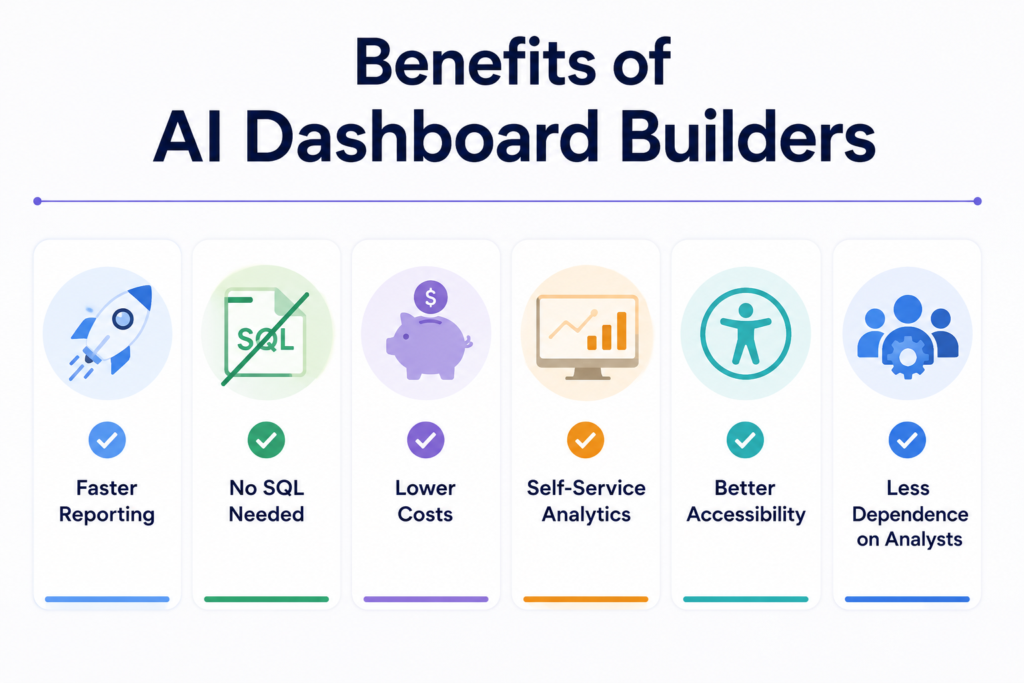
AI dashboard builders reduce manual reporting while making analytics accessible to business users.
They make analytics accessible to a wider range of users.
Faster Dashboard Creation
What once took days or weeks can often be completed in minutes.
Teams gain access to insights faster and spend less time waiting for reports.
No SQL Required
Users do not need database knowledge to build dashboards.
Natural language replaces complex queries.
Reduced Dependence on Analysts
Business teams can access information without constantly relying on data specialists.
This reduces bottlenecks and improves productivity.
Lower Reporting Costs
Organizations can reduce the amount of manual reporting work required across departments.
Self-Service Analytics
Users can explore data independently and answer their own questions without waiting for assistance.
Better Access to Insights
Analytics becomes available to more people across the organization, not only technical teams.
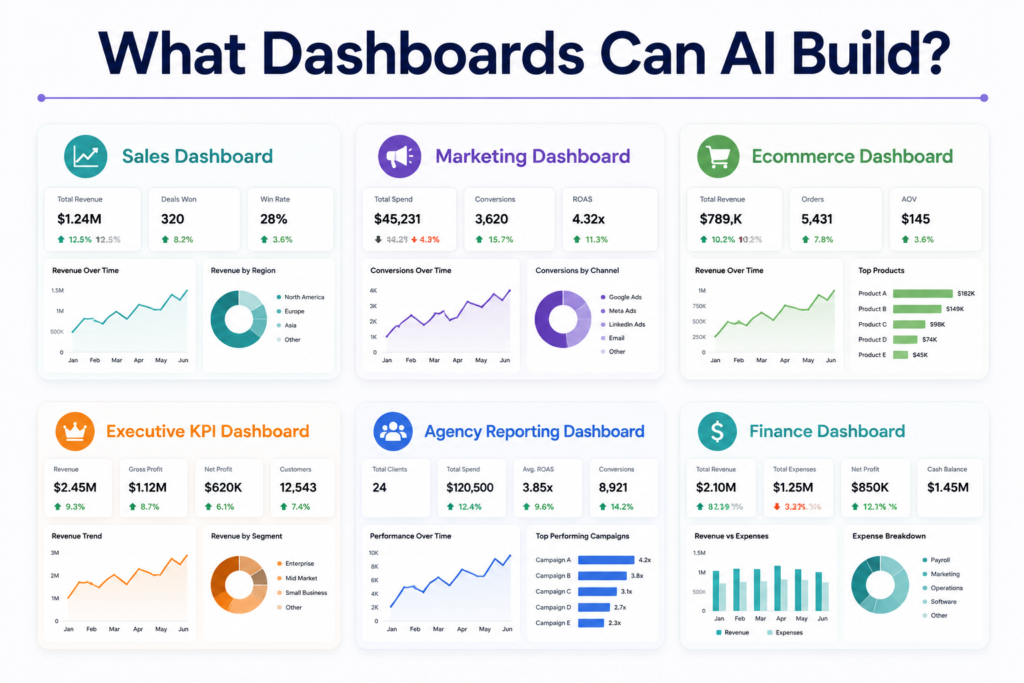
What Dashboards Can AI Create?
One of the biggest advantages of AI dashboard builders is flexibility.
Instead of being limited to predefined templates, users can generate dashboards based on their specific goals and data sources.
Here are some common examples.
Sales Dashboards
Sales teams can track:
- Revenue growth
- Pipeline performance
- Win rates
- Sales by region
- Top-performing products
This helps managers identify opportunities and improve forecasting.
Marketing Dashboards
Marketing teams often need visibility into multiple channels.
An AI dashboard can combine data from web analytics platforms, advertising channels, CRM systems, and marketing tools to provide a complete view of campaign performance.
To provide a complete view of campaign performance.
Ecommerce Dashboards
Online stores can monitor:
- Revenue
- Orders
- Inventory levels
- Customer acquisition
- Product performance
Without manually compiling reports from different systems.
Executive KPI Dashboards
Executives often want a high-level overview of business performance.
AI-generated dashboards can surface:
- Revenue
- Profitability
- Customer growth
- Retention metrics
- Operational KPIs
In a single view.
Agency Reporting Dashboards
Agencies can create dashboards for clients and provide real-time access to campaign performance instead of sending static reports.
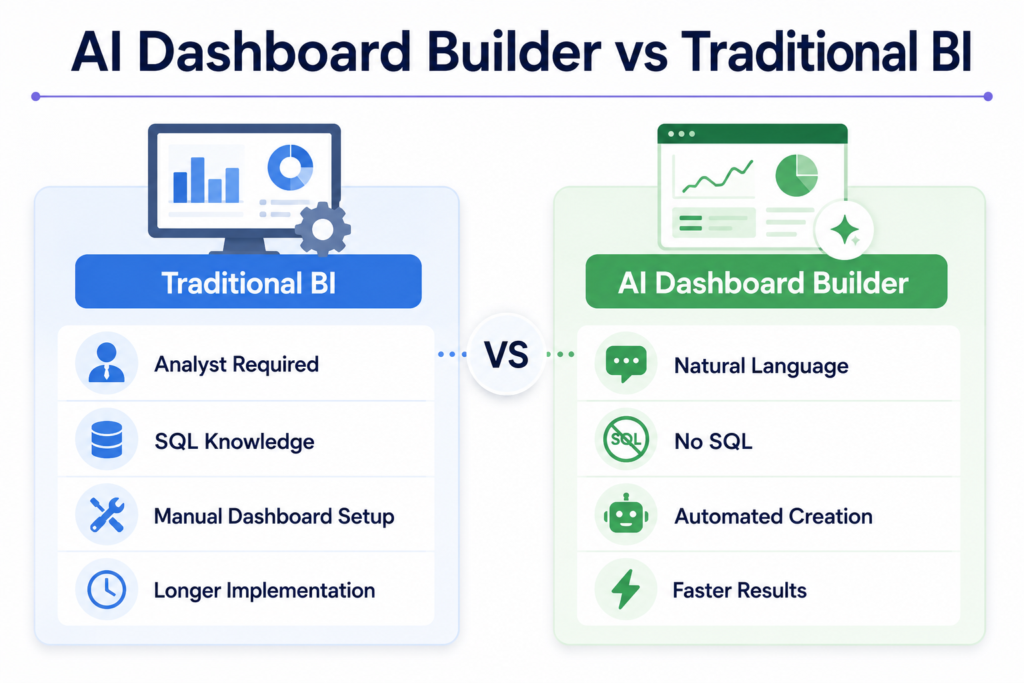
AI Dashboard Builder vs Traditional BI Tools
AI dashboard builders and traditional business intelligence platforms both help organizations analyze data.
The difference is how dashboards are created and maintained.
| Feature | AI Dashboard Builder | Traditional BI Tools |
| Dashboard Creation | Automated | Manual |
| SQL Knowledge | Not Required | Often Required |
| Analyst Dependency | Low | High |
| Setup Time | Minutes | Days or Weeks |
| Accessibility | High | Moderate |
| Learning Curve | Lower | Higher |
Traditional business intelligence platforms such as Microsoft Power BI, and Looker remain powerful enterprise analytics tools.
The right platform depends on your team’s technical skills, reporting requirements, and existing data stack.
Many organizations are now adopting AI dashboard builders to reduce manual reporting and make analytics more accessible.
This is where AI dashboard builders provide a significant advantage.
Can AI Build Power BI Dashboards?
Yes. AI can help build Power BI dashboards by generating reports, identifying metrics, and assisting with dashboard design.
However, Power BI still requires users to work within the Microsoft ecosystem and configure dashboards inside the platform.
Many organizations are now exploring AI-native dashboard builders that simplify the process even further.
Instead of learning a business intelligence tool, users can simply ask questions in plain English and allow AI to generate dashboards automatically.
This approach reduces setup time and makes analytics accessible to non-technical users.
Whichever analytics platform you are using, AI is becoming a core part of how dashboards are created and managed..
Why Choose Papercrane as Your AI Dashboard Builder?
Papercrane is an AI dashboard builder that helps teams connect business data and generate dashboards using natural language instead of SQL or manual reporting.
With Papercrane, you can:
- Build dashboards without SQL.
- Connect multiple data sources from one platform.
- Generate visualizations in minutes.
- Share dashboards with a simple link.
- Reduce dependence on analysts for everyday reporting.
Whether you’re tracking marketing campaigns, product usage, revenue, or executive KPIs, Papercrane helps teams move from raw data to actionable insights faster.
Ready to build a dashboard with AI? Sign up for Papercrane and create your first dashboard in minutes.
Frequently Asked Questions
What is an AI dashboard builder?
An AI dashboard builder is a tool that uses artificial intelligence to create dashboards, reports, and visualizations based on natural language prompts and connected data sources.
Can AI create dashboards automatically?
Yes. Modern AI dashboard builders can analyze connected data, understand user requests, and generate dashboards automatically.
Do I need SQL to build dashboards with AI?
No. Most AI dashboard builders are designed to eliminate the need for SQL by allowing users to describe what they want in plain English.
Can AI build Power BI dashboards?
AI can assist with Power BI dashboards, but AI-native dashboard builders often provide a faster and more accessible experience for non-technical users.
What data sources can AI dashboard builders connect to?
Most platforms support common sources such as Google Analytics 4, HubSpot, BigQuery, PostgreSQL, Snowflake, CRM systems, and other business applications.
Key Takeaways
- AI dashboard builders reduce the need for analysts and manual reporting.
- Users can create dashboards using natural language instead of SQL.
- Dashboards that once took days to build can now be generated in minutes.
- AI makes analytics more accessible across organizations.
- Modern teams can build, share, and manage dashboards with less technical effort.
Build Dashboards Without Analysts or SQL
Traditional dashboard creation often requires analysts, technical expertise, and significant setup time.
Papercrane simplifies the process.
Connect your business data, describe what you want to see in plain English, and let AI generate dashboards in minutes. Describe what you want to see in plain English, and let AI generate dashboards in minutes.
Start building dashboards faster and give your team instant access to the insights that matter most.