Snowflake Dashboard in Minutes: BI Without a Separate Tool
August 29, 2026
·
Tim Liu
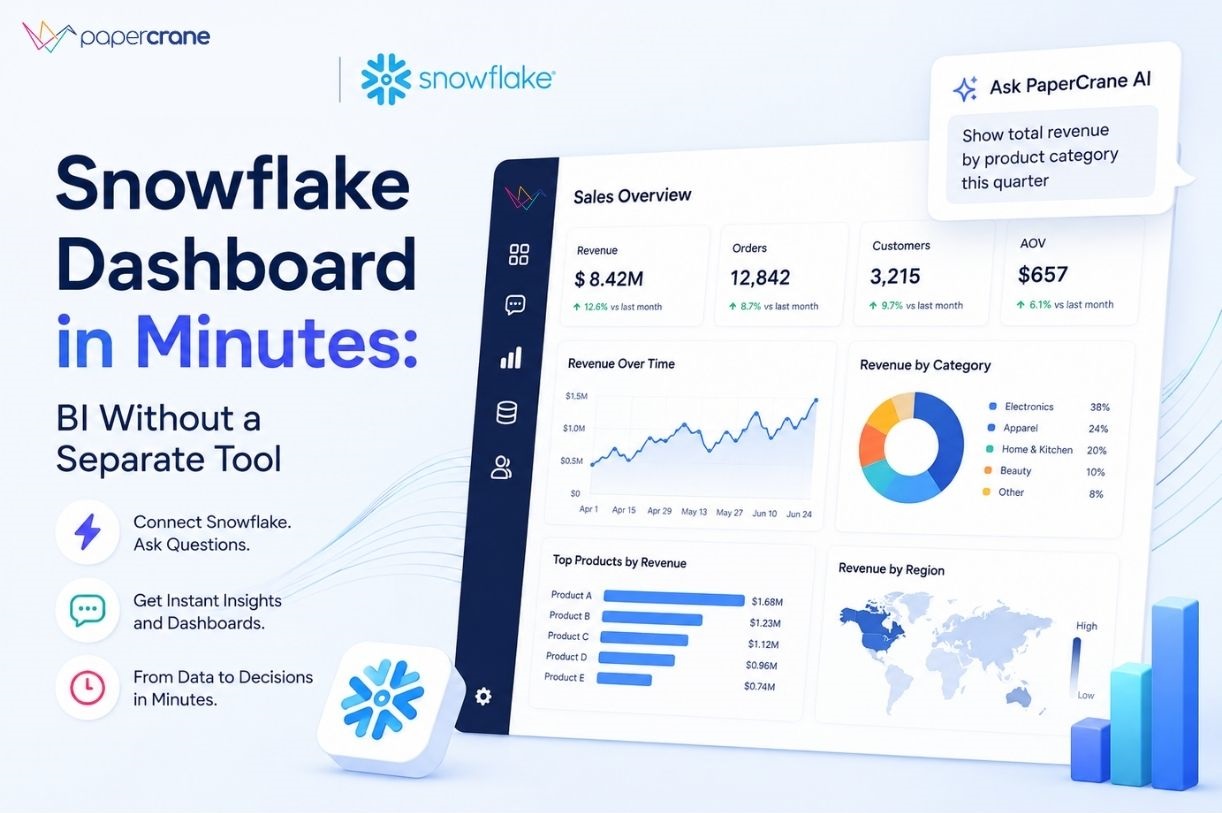
You built the data warehouse. You migrated to Snowflake, modeled your tables, and finally have clean, reliable data in one place. The hard part is supposed to be over.
But when your CEO asks for a revenue chart, someone opens a ticket for the analyst. When your marketing lead wants to see this week’s campaign spend, someone exports a CSV. Your data is ready. Your team’s access to it isn’t.
The standard advice, buy Tableau, configure Power BI, stand up Looker, sounds reasonable until you’re three weeks into onboarding, paying $50 per seat, and your stakeholders still can’t open a live dashboard without asking for help. That’s not a visibility solution. That’s a second problem dressed up as a fix.
Why Snowflake’s Native UI Isn’t a Real Dashboard Solution
Snowflake ships with a built-in interface called Snowsight. You can run SQL there and see a chart. For a data engineer doing exploratory analysis, that’s genuinely useful.
For your marketing manager, your CFO, or your ops lead, it’s a dead end. Snowsight requires SQL to get anything out of it. There’s no shareable live dashboard, no auto-refresh, no drill-down your non-technical teammates can navigate on their own. It’s a query tool that happens to draw charts, not a snowflake dashboard your whole team can actually use.
So the natural next move is adding a dedicated BI tool. And that’s where the “tool tax” kicks in.
The Real Cost of Traditional Snowflake BI Tools
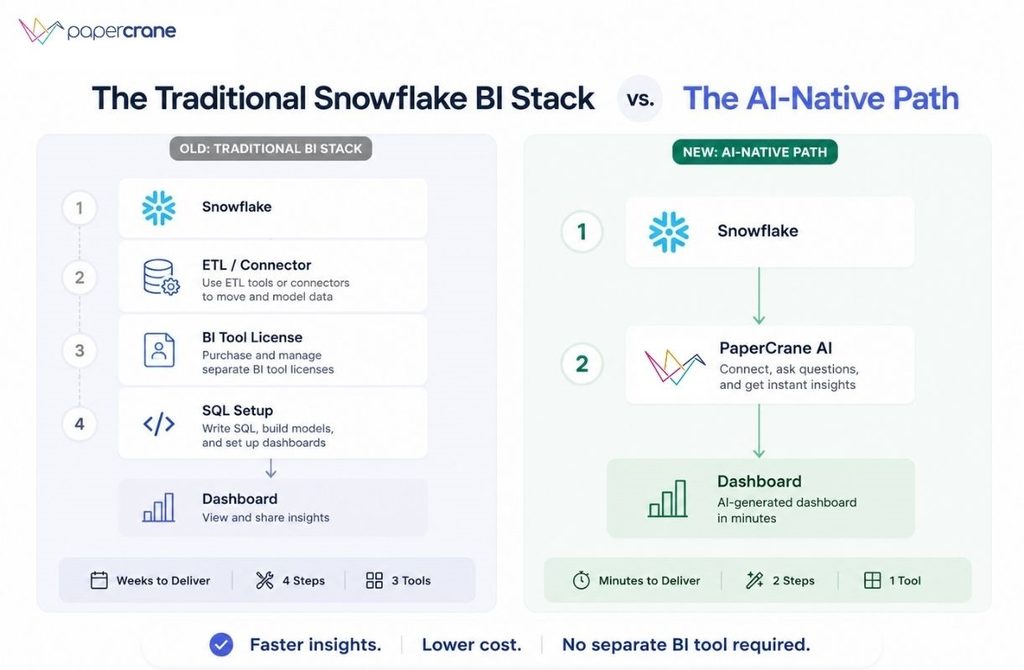
Layering Tableau, Power BI, or Looker on top of Snowflake typically means: a new vendor contract, a 2-4 week onboarding project, per-seat licensing that compounds with every new hire ($15-$75/user/month depending on the tool), and Snowflake compute credits burning on every query a dashboard runs. For a 10-person team, that’s often $5,000–$10,000 per year in BI licensing, before a single dashboard is live.
The problem isn’t the visualization. The problem is that every traditional snowflake dashboard tool was designed around the assumption that you have a dedicated data team to set it up and maintain it. Most growing teams don’t.
What a Real Snowflake Analytics Dashboard Should Do
Before getting into how PaperCrane solves this, it’s worth being clear on what “good” actually looks like. The bar is higher than most teams realize when they’re stuck in the old model.
A proper snowflake analytics dashboard should:
- Connect live to your Snowflake tables: No CSV exports, no manual data pulls, no staging copies
- Work for non-technical users: Anyone on your team should be able to open it, filter it, and understand it without writing a query
- Refresh automatically: The numbers your team sees should reflect what’s actually in Snowflake today, not last Tuesday
- Alert you when something changes: Proactive notifications when a metric crosses a threshold, not reactive scrambles after a stakeholder spots a problem
- Take minutes to set up, not weeks: Your first dashboard should be live the same day you connect your data
Most traditional snowflake bi tools check one or two of these boxes. They weren’t designed to check all five for a team without a dedicated BI engineer. PaperCrane was.
How to Build a Snowflake Dashboard with PaperCrane in Minutes
This is the part every competitor blog skips. They tell you to “connect Tableau to Snowflake” and leave you with a 40-step setup guide. Here’s what it actually looks like with an AI-native tool built for this exact use case.
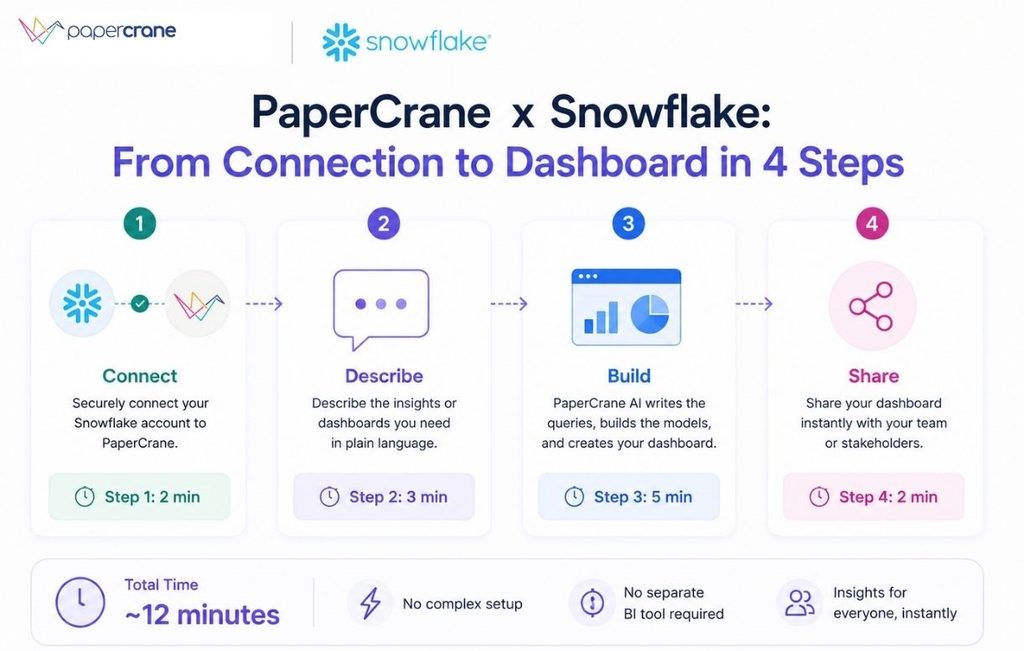
Step 1: Connect Your Snowflake Account Under 2 Minutes
Go to PaperCrane’s Snowflake connector and enter your Snowflake account URL and credentials. That’s it. No ETL pipeline to configure. No data copying to a separate environment. Your Snowflake data stays exactly where it is, PaperCrane reads it directly.
What happens behind the scenes: PaperCrane automatically scans your database schema, maps your tables and views, and identifies the relationships between them. You don’t need to explain your data model or draw an ERD. The AI does that work.
Step 2: Describe What You Want In Plain English
No SQL. No drag-and-drop query builder. Just type what you want to see.
“Show me monthly revenue by product for the last quarter.” “What’s our customer acquisition cost by channel this month?” “Compare this week’s conversion rate to the same period last month.”
PaperCrane translates your request into an optimized Snowflake query, runs it, and renders the right chart type automatically. You see bar chart, line graph, KPI scorecard, cohort table, whatever fits the shape of the data. If the first output isn’t quite right, you refine it in plain language. No one writes SQL. That’s the point.
If you want to understand more about how this works under the hood, this breakdown of AI dashboard builders that work without SQL goes deeper into the mechanics.
Step 3: Build Your Full Dashboard: Arrange, Filter, Share
Pin your charts to a dashboard. Add date-range filters. Set up segment filters by region, channel, product, team, whatever dimensions your data has. Create drill-down paths so a stakeholder can click into a number and understand where it came from, without pinging an analyst.
PaperCrane suggests relevant charts based on the tables you’ve connected and fills in a starter dashboard layout so you’re not staring at a blank canvas. Anyone on your team can adjust their view without touching the shared version.
Step 4: Automate Refresh, Set Alerts, and Share
Set your refresh schedule to hourly, daily, or on-demand. Configure threshold alerts: “Notify me when ROAS drops below 2x” or “Flag when CAC exceeds our monthly target.” Share via a secure link, embed in Notion or your internal portal, or export to PDF for weekly reporting.
PaperCrane handles all query scheduling against Snowflake, optimizes query patterns to minimize compute credit consumption, and manages permission levels so the right people see the right data. Your first dashboard can be live, genuinely live, with real Snowflake data, shared with your team in under 15 minutes.
What Teams Actually Build: Snowflake Dashboard Examples with PaperCrane
The steps above tell you how. Here’s what teams actually produce once they’re connected.
Marketing Teams for Campaign Performance Dashboards
Ad spend, ROAS, and channel attribution data sits in Snowflake. PaperCrane pulls it into a live snowflake analytics dashboard. Spend by channel, cost per acquisition by campaign, week-over-week trend lines, without a single CSV export or SQL query. Marketing managers check it every morning like a weather report.
Revenue and Finance Teams for Live MRR and P&L Reporting
Connect your Snowflake finance tables and ask PaperCrane to build an MRR dashboard with churn rate, expansion revenue, and LTV breakdowns. Updated daily. Shared with leadership via a link. No more waiting for the analyst to run the monthly report or reconciling three different versions of the same number.
Product and Growth Teams for Funnel and Retention Dashboards
Event tables in Snowflake hold every click, signup, and feature interaction your users produce. PaperCrane turns them into funnel visualizations, cohort retention charts, and feature adoption breakdowns, the kind of snowflake data visualization that used to require a dedicated product analytics tool and a data engineer to maintain it.
Operations Teams for Real-Time Operational Dashboards
Inventory levels, SLA compliance, fulfillment rates, ops data lives in Snowflake, but ops managers can’t write SQL. PaperCrane gives them a live dashboard for snowflake data they can check every morning without involving IT. Problems surface before they become escalations.
Agencies and Client Reporting for Embeddable White-Label Dashboards
If you manage client data in Snowflake, PaperCrane lets you build branded, embeddable dashboards and share them as white-labeled links. Clients see clean, live snowflake reporting with no Snowflake login, no BI tool seat, and no technical setup on their end.
According to Snowflake’s Modern Marketing Data Stack report, marketing teams are centralizing more data in Snowflake than ever, but the visibility gap between what’s in the warehouse and what stakeholders can actually see remains one of the top operational frustrations.

PaperCrane vs. Traditional Snowflake BI Tools
Now that you’ve seen what PaperCrane actually does, the comparison to traditional tools lands differently than a spec-sheet comparison would.
| Criteria | Tableau / Power BI / Looker | PaperCrane |
|---|---|---|
| Setup time | 1-4 weeks | Under 15 minutes |
| SQL required | Yes, for any custom dashboard | No, plain English |
| Licensing cost | $15–$75/user/month | Included |
| Non-technical users | View-only in most tiers | Full self-service |
| AI-native | Bolt-on feature | Core function |
| Snowflake connection | Requires connector configuration | Direct, automatic |
| Compute optimization | Manual tuning required | Built-in |
| First dashboard live | Days to weeks | Same session |
For teams who’ve already looked at traditional snowflake bi tools and felt the weight of onboarding, licensing, and SQL dependency. PaperCrane is built on a different assumption: that your team shouldn’t need a data engineer just to see their own data.
You can compare PaperCrane directly against other Snowflake tools here if you’re mid-evaluation.
According to Gartner’s 2025 Magic Quadrant for Analytics and BI Platforms, ease of use and time-to-insight are now the top evaluation criteria for BI tool selection, overtaking raw visualization capability for the first time. That shift is exactly what AI-native tools like PaperCrane are built for.
Frequently Asked Questions
Can Snowflake create its own dashboards?
Snowflake includes a native interface called Snowsight that can display charts from SQL query results, but it requires SQL knowledge and isn’t designed for business users or ongoing team reporting. For a production snowflake dashboard your whole team can access and act on, you need a dedicated tool. Ideally one that connects directly to Snowflake without requiring SQL.
What is the easiest way to build a dashboard on Snowflake?
The easiest path to a live snowflake analytics dashboard is an AI-native tool like PaperCrane. You connect your Snowflake account, describe what you want to see in plain English, and the AI builds and renders the dashboard. No SQL, no BI tool license to configure, no onboarding project.
Does building dashboards on Snowflake cost extra compute?
It can. Traditional snowflake bi tools that run live queries on every dashboard refresh do consume compute credits with each page load. PaperCrane optimizes query patterns and uses result caching to minimize credit consumption, so your snowflake reporting costs stay predictable as your team grows.
Do I need Tableau or Power BI to visualize Snowflake data?
No. Tableau, Power BI, and Looker are well-known options for snowflake data visualization, but they’re not the only path. And for teams without a dedicated data engineer, they often create more friction than they solve. AI-native tools connect directly to Snowflake and let non-technical users build and share dashboards without a separate BI license or SQL expertise.
How long does it take to build a working Snowflake dashboard
With a traditional snowflake dashboard tool, setup typically takes one to four weeks including connector configuration, data modeling, and user training. With PaperCrane, the average time from connecting your Snowflake account to sharing your first live dashboard is under 15 minutes.
Your Snowflake Data Is Ready. Your Dashboard Should Be Too.
The data is already in Snowflake. The problem has never been storage, it’s been the gap between raw tables and the insights your whole team can open, understand, and act on without asking for help.
That gap used to require an analyst, a BI license, weeks of setup, and ongoing SQL maintenance. It doesn’t anymore.
PaperCrane connects to your Snowflake account, reads your schema, and turns your data into a live, shareable snowflake dashboard in minutes, no SQL, no separate BI tool, no onboarding project. Marketing managers, finance leads, ops teams, and executives can all see the same live data, filtered to what they care about, updated automatically.
If you’re already paying for Snowflake, you’ve already done the hard part. Connect your Snowflake account and build your first dashboard free →
And if you’re curious how this compares to building analytics dashboards for other data sources, see how Stripe analytics dashboards are built the same way →