PostgreSQL Dashboard in Minutes: No SQL Required
July 23, 2026
·
Tim Liu
If your business stores data in PostgreSQL, you’re already sitting on valuable insights. The challenge is turning that data into reports your team can actually use.
A PostgreSQL dashboard solves this by transforming raw database records into interactive charts, reports, and KPIs that help teams monitor performance in real time.
Modern AI-powered dashboard builders take this a step further by allowing you to generate dashboards without writing SQL, making PostgreSQL reporting faster and more accessible for technical and non-technical users alike.
What Is a PostgreSQL Dashboard?
A PostgreSQL dashboard is a visual interface that transforms data stored in a PostgreSQL database into interactive charts, graphs, tables, and key performance indicators (KPIs).
Data stored in PostgreSQL can be queried, analysed, and visualised using reporting tools, as described in the official PostgreSQL documentation.
Traditionally, building dashboard for PostgreSQL involved connecting your database to a business intelligence (BI) tool, writing SQL queries, and manually creating visualisations.
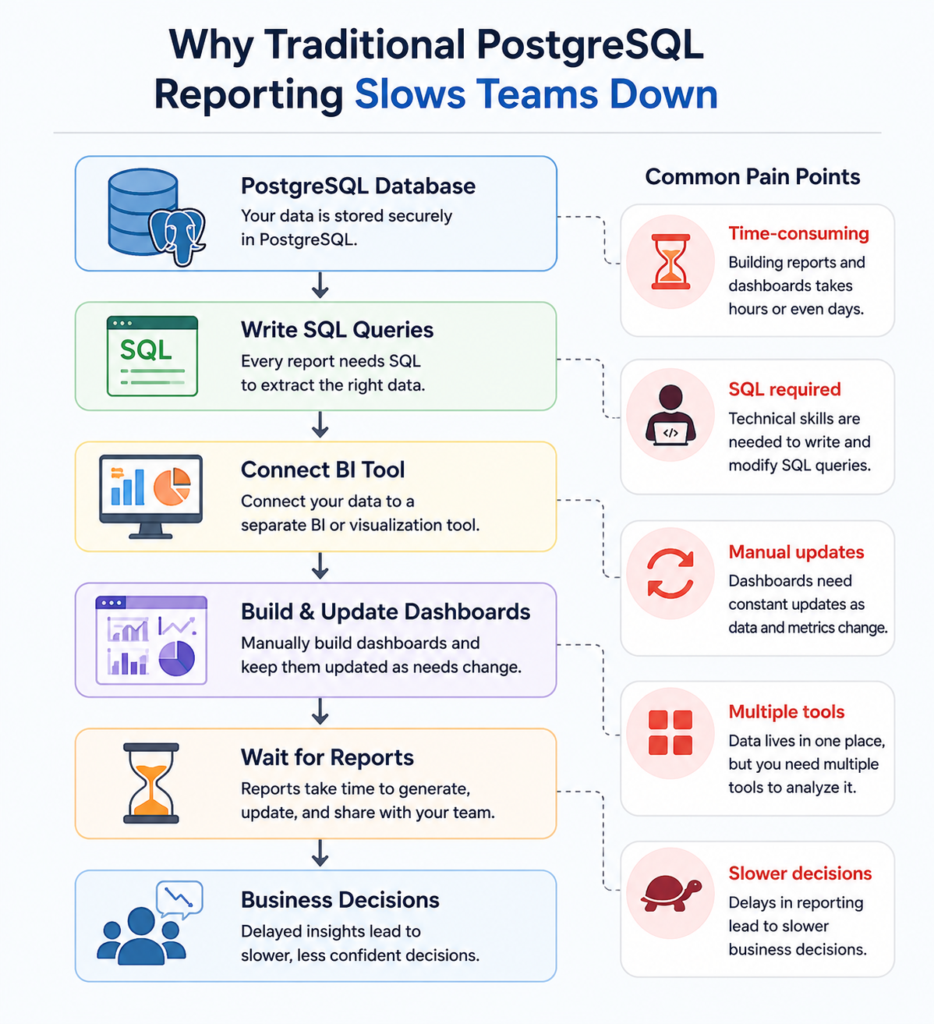
Today, AI-powered dashboard builders simplify the process by allowing users to connect their PostgreSQL database, ask questions in plain English, and generate interactive dashboards without writing SQL.
This makes PostgreSQL analytics and reporting more accessible to business teams while reducing reliance on developers and data analysts.
Why PostgreSQL Reporting Becomes a Bottleneck
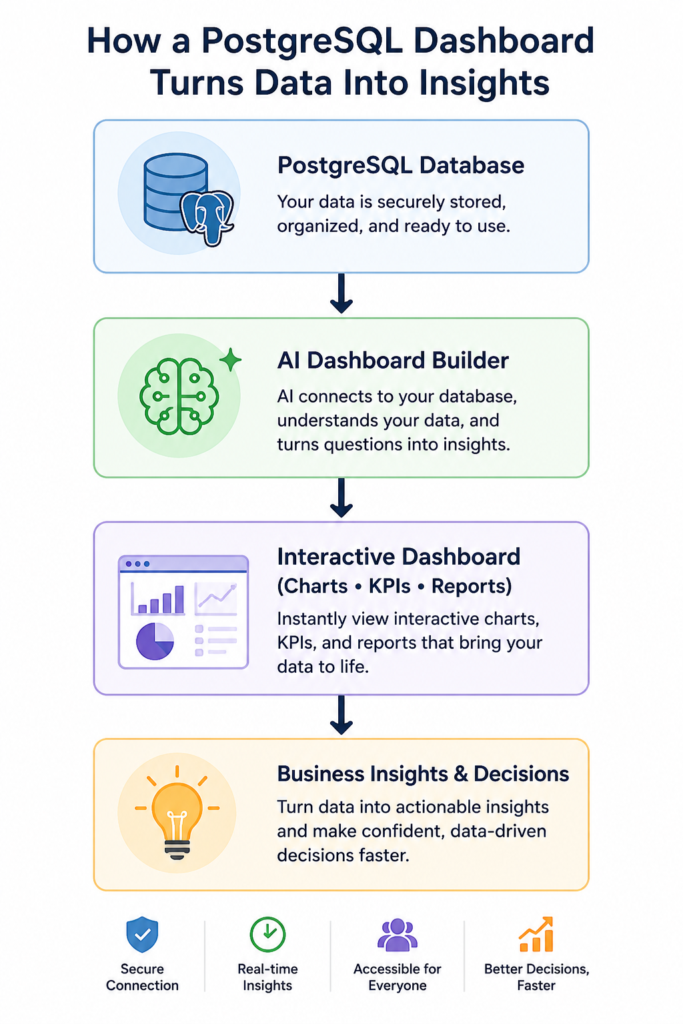
PostgreSQL is highly reliable for storing and managing structured business data. However, as databases grow and reporting requirements become more complex, creating dashboards and reports often requires significant manual effort.
Common challenges include:
- SQL dependency: Every new report or dashboard often requires writing or modifying SQL queries.
- Multiple tools: Building a PostgreSQL dashboard means switching between PostgreSQL, BI platforms, and visualisation tools.
- Delayed reporting: Business users frequently rely on developers or data analysts to create or update reports.
- Manual dashboard maintenance: As metrics and business requirements change, dashboards need continuous updates.
- Slower decision-making: Waiting for reports can delay important business decisions and reduce productivity.
Expert Tip:
Before building a dashboard, define the business questions you want to answer first. Dashboards built around a small set of meaningful KPIs are easier to maintain and more valuable than dashboards filled with unnecessary charts.
AI-powered tools simplify PostgreSQL visualization by automatically creating charts and dashboards from natural language questions.
Build PostgreSQL Dashboards Without Writing SQL
Rather than building every report from scratch, AI dashboard builders understand your database structure and translate natural language into the queries needed to retrieve the right data.
For example, instead of writing SQL, you can ask questions like:
- Show monthly revenue by region.
- Compare sales performance for the last 12 months.
- Which products generated the highest profit this quarter?
- Display customer growth by month.
The AI automatically retrieves the relevant data and presents it as charts, KPIs, and reports, making PostgreSQL data visualization faster and easier for everyone.
Focus on Insights, Not SQL
The purpose of a PostgreSQL dashboard is to help teams make quick accurate decisions.
AI-powered dashboards reduce manual work by automating data retrieval, visualisation, and reporting, allowing teams to focus on analysing trends instead of building dashboards.
PostgreSQL Dashboard vs Traditional Reporting Tools
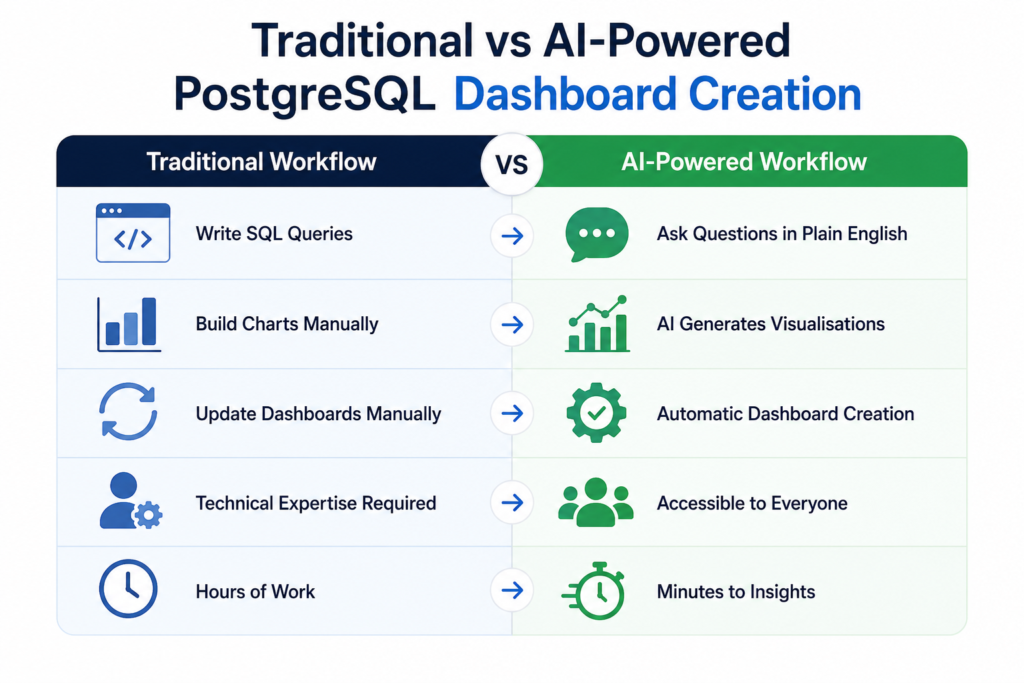
Choosing the right reporting solution depends on your team’s technical skills, reporting needs, and how quickly you need insights.
| Traditional Reporting Tools | AI Dashboard Builder |
|---|---|
| SQL queries required | Ask questions in plain English |
| Manual dashboard creation | AI generates dashboards automatically |
| Multiple reporting tools | One unified workspace |
| Technical expertise needed | Suitable for technical and non-technical users |
| Hours to build reports | Interactive dashboards in minutes |
Popular PostgreSQL reporting tools such as Grafana, Metabase, Tableau, Power BI, and Apache Superset are excellent options for data visualisation and business reporting.
However, they often require users to understand database structures, write SQL queries, or manually configure dashboards before meaningful insights can be generated.
AI dashboard builders reduce these steps by allowing users to interact with PostgreSQL data using natural language, making reporting faster and more accessible across the organisation.
PostgreSQL Dashboard vs Static Reports
While the choice of reporting tool affects how dashboards are built, it’s also important to understand why businesses increasingly prefer interactive dashboards over traditional static reports.
| PostgreSQL Dashboard | Static Reports |
|---|---|
| Interactive | Fixed |
| Real-time insights | Historical snapshots |
| Filterable | Limited filtering |
| Live KPIs | Static metrics |
| Supports faster decisions | Slower reporting cycles |
Unlike static reports, PostgreSQL dashboards update as new data becomes available, giving teams continuous visibility into business performance. This makes it easier to monitor KPIs, identify trends, and respond to changes more quickly.
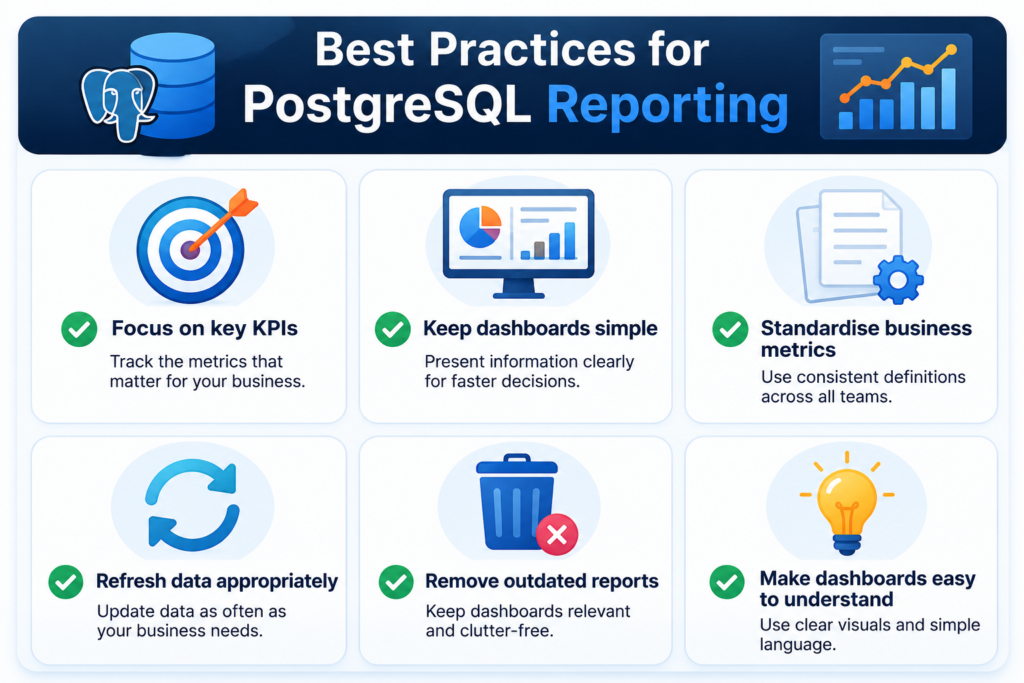
Best Practices for PostgreSQL Reporting
Whether you’re creating dashboards manually or using AI, following a few best practices will help you build more effective reports and improve PostgreSQL business intelligence.
- Focus on business metrics that support decision-making instead of tracking every available data point.
- Keep dashboards simple so users can quickly understand key trends.
- Group related KPIs together to avoid cluttered reports.
- Refresh dashboards only as frequently as your business requires to reduce unnecessary processing.
- Standardise metrics across teams to ensure everyone works from the same data.
- Regularly review dashboards and remove reports that are no longer useful.
Following these practices improves the quality of PostgreSQL reporting while making dashboards easier to maintain as your organisation grows.
When Should You Use an AI Dashboard Builder?
Traditional reporting works well for technical teams that are comfortable writing SQL and managing BI tools.
You should consider an AI dashboard builder if you:
- Build reports from PostgreSQL regularly.
- Depend on developers or analysts to answer business questions.
- Need dashboards that update quickly as your data changes.
- Want non-technical users to explore data independently.
- Need faster reporting without writing SQL.
If you’re looking to simplify reporting, learn how to build a BigQuery Dashboard using the same AI-powered approach.
Frequently Asked Questions
What is a PostgreSQL dashboard?
Quick Answer:
A PostgreSQL dashboard is an interactive reporting interface that transforms data stored in a PostgreSQL database into charts, tables, graphs, and KPIs. PostgreSQL consistently ranks among the world’s most popular relational database management systems in the annual Stack Overflow Developer Survey.
Key Takeaway
A PostgreSQL dashboard turns raw database records into interactive visual reports, making it easier for businesses to monitor KPIs, analyse trends, and make faster decisions.
How do I create a PostgreSQL dashboard?
You can create a PostgreSQL dashboard by connecting your database to a business intelligence or dashboard platform, querying your data, creating visualisations, and sharing the dashboard with your team. AI-powered dashboard builders simplify this process by generating dashboards without requiring SQL.
Can I build a PostgreSQL dashboard without SQL?
Yes. Modern AI dashboard builders allow users to connect their PostgreSQL database, ask questions in plain English, and generate dashboards without writing SQL queries manually.
What are the best PostgreSQL reporting tools?
Some of the most popular PostgreSQL reporting tools include Grafana, Metabase, Tableau, Power BI, Apache Superset, and AI-powered dashboard builders. The right choice depends on your reporting needs, technical expertise, and preferred workflow.
How do I visualise PostgreSQL data?
You can visualise PostgreSQL data using charts, graphs, dashboards, and KPIs created with reporting or business intelligence tools. AI-powered platforms also generate PostgreSQL data visualization automatically from natural language queries.
Can AI generate PostgreSQL dashboards?
Yes. AI-powered dashboard builders can connect to PostgreSQL, understand your database schema, generate SQL behind the scenes, and create interactive dashboards based on your questions, making PostgreSQL analytics much faster and easier.
Why Teams Choose Papercrane
Papercrane automatically translates your questions into SQL, retrieves the right data, and creates visual reports. It eliminates much of the manual work involved in traditional reporting.
| Traditional Reporting | Papercrane |
|---|---|
| Write SQL manually | Ask questions in plain English |
| Configure multiple BI tools | Connect once and start analysing |
| Build dashboards from scratch | AI generates dashboards automatically |
| Manual report maintenance | Faster, AI-assisted reporting |
| Technical expertise required | Designed for both technical and business users |
| Hours to create reports | Insights in minutes |
Papercrane is built for teams that want to make data more accessible without adding unnecessary complexity.
Instead of learning new reporting tools or relying on developers for every dashboard request, anyone can explore PostgreSQL data through a simple conversational interface.
If you’re looking for a faster, more cost-effective way to build PostgreSQL dashboards, Papercrane helps you turn raw data into actionable insights, without the traditional reporting overhead.
Ready to build?
Start with your first dashboard today. No credit card required.