BigQuery Dashboard: Build Interactive Dashboards Without SQL
July 21, 2026
·
Tim Liu
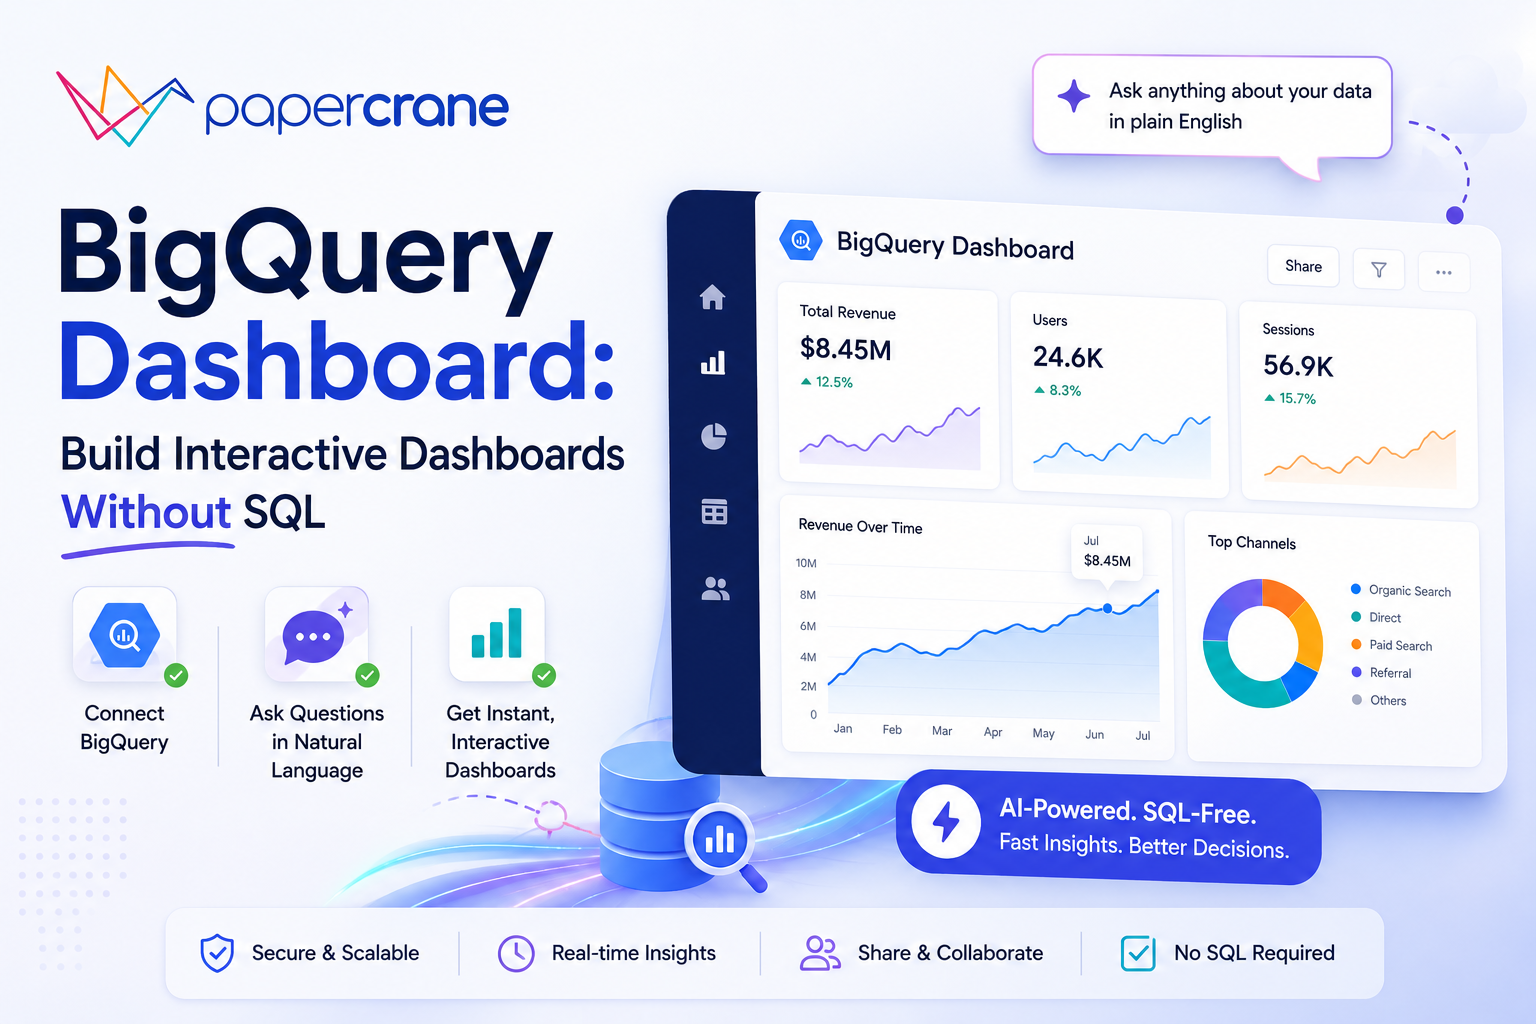
Your data is already in BigQuery, but getting answers from it is still a challenge. Teams spend hours writing SQL queries, switching between BI tools, or waiting for analysts to create reports.
By the time a dashboard is ready, the opportunity to act may already be gone.
A BigQuery dashboard transforms data stored in Google BigQuery into interactive charts and reports, making it easier to track performance, identify trends, and make faster decisions.
But creating a Google BigQuery dashboard is often slower and more complex than many businesses expect, especially for non-technical teams.
Benefits of BigQuery Dashboards
Whether you’re tracking revenue, customer growth, product usage, or marketing performance, a BigQuery dashboard brings your most important metrics into one place.
Instead of searching through raw datasets or relying on manual reports, teams can monitor performance, identify trends, and make faster, data-driven decisions.
Some of the major benefits include:
- Centralized reporting: View key business metrics from a single dashboard instead of switching between multiple tools.
- Faster decision-making: Access up-to-date insights that help teams respond quickly to changing business conditions.
- Improved collaboration: Share dashboards with stakeholders so everyone works from the same data.
- Reduced manual reporting: Automate recurring reports and spend less time preparing spreadsheets.
- Scalable analytics: As your data grows, dashboards make it easier to monitor performance without increasing reporting complexity.
The right dashboard helps teams spend less time gathering information and more time acting on it.
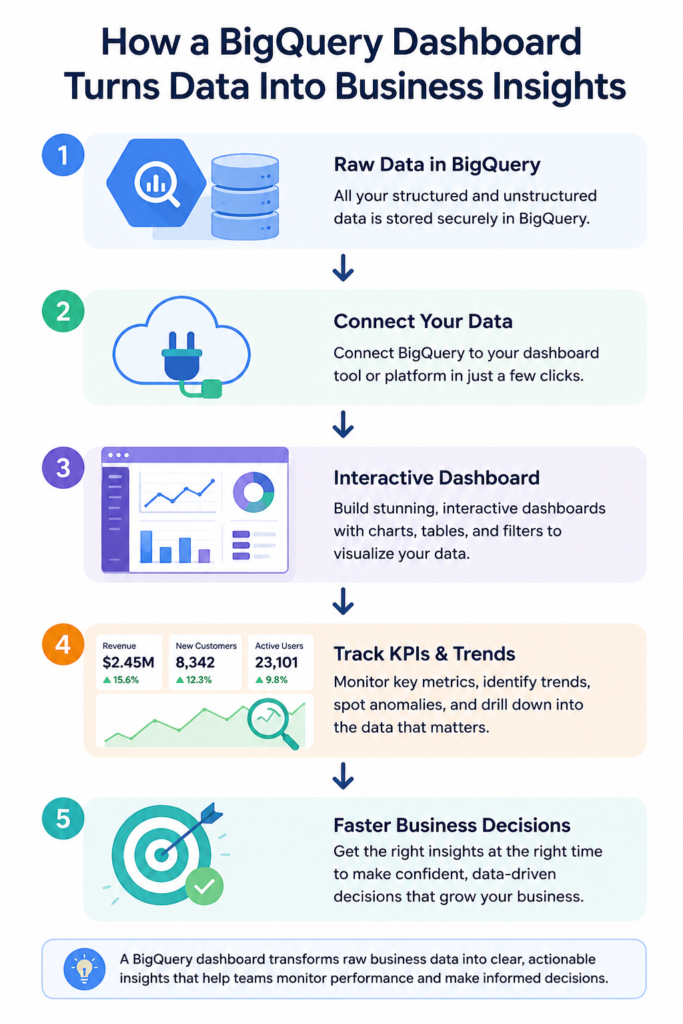
Why Traditional BigQuery Dashboards Are Difficult to Build
While BigQuery is built to store and process massive datasets, creating dashboards often requires technical expertise, multiple tools, and ongoing maintenance.
Common challenges include:
- Writing SQL queries to retrieve and organize the right data
- Connecting BigQuery with BI tools before building visualizations
- Designing charts and reports that answer business questions effectively
- Keeping dashboards updated as datasets and reporting requirements evolve
- Relying on analysts or developers whenever new reports or changes are needed
As data volumes grow, maintaining traditional dashboards becomes increasingly difficult, especially for organizations that need quick answers from their data.
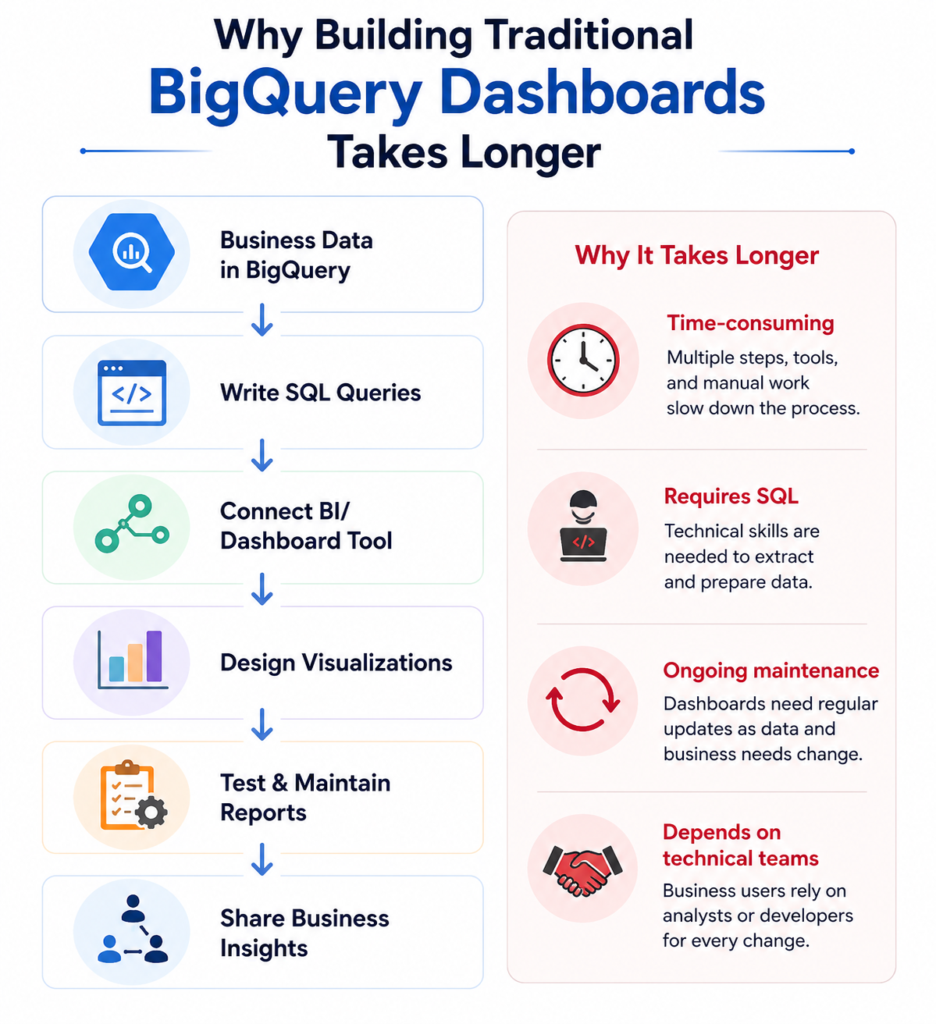
How to Build a BigQuery Dashboard
Building a BigQuery dashboard involves more than connecting your data to a reporting tool.
Whether you’re creating a dashboard for BigQuery for marketing, finance, or operations, you need a structured process that ensures your data is accurate, easy to understand, and accessible to the right people.
Step 1: Connect Your BigQuery Data
Start by connecting your Google BigQuery dataset to your preferred dashboard platform. Most BI tools allow you to import data directly, giving you a foundation for creating reports and visualizations.
Step 2: Prepare and Organize Your Data
Before building charts, make sure your data is clean, properly structured, and organized around the metrics that matter most to your business. Well-prepared data leads to more accurate dashboards and better reporting.
Expert Tip: Avoid building dashboards around every available metric. Focus on the KPIs that directly support business decisions. A simpler dashboard with clear objectives is often more valuable than one filled with dozens of charts.
Step 3: Create Meaningful Visualizations
Choose charts, tables, and KPIs that clearly answer business questions. Avoid adding unnecessary visuals that make dashboards harder to interpret.
Expert Tip: Start by identifying the decisions your dashboard should support, then build visualizations around those business questions instead of trying to display every available metric.
Step 4: Test, Share, and Monitor
Review your dashboard to ensure the data is accurate, then share it with your team. As your business grows, update your dashboard regularly to reflect new metrics and changing reporting needs.
A Faster Alternative: Build BigQuery Dashboards with AI
Traditional dashboard creation often involves SQL queries and business intelligence tools such as Looker Studio, along with ongoing maintenance.
AI dashboard builders make it much easier to build a BigQuery dashboard without writing complex SQL queries or manually configuring reports.
This shift toward self-service analytics allows business users to explore data and generate insights independently, reducing reliance on technical teams for routine reporting.
Business users can quickly explore data, customize visualizations, and share embedded dashboards and insights without relying on technical teams for every change.
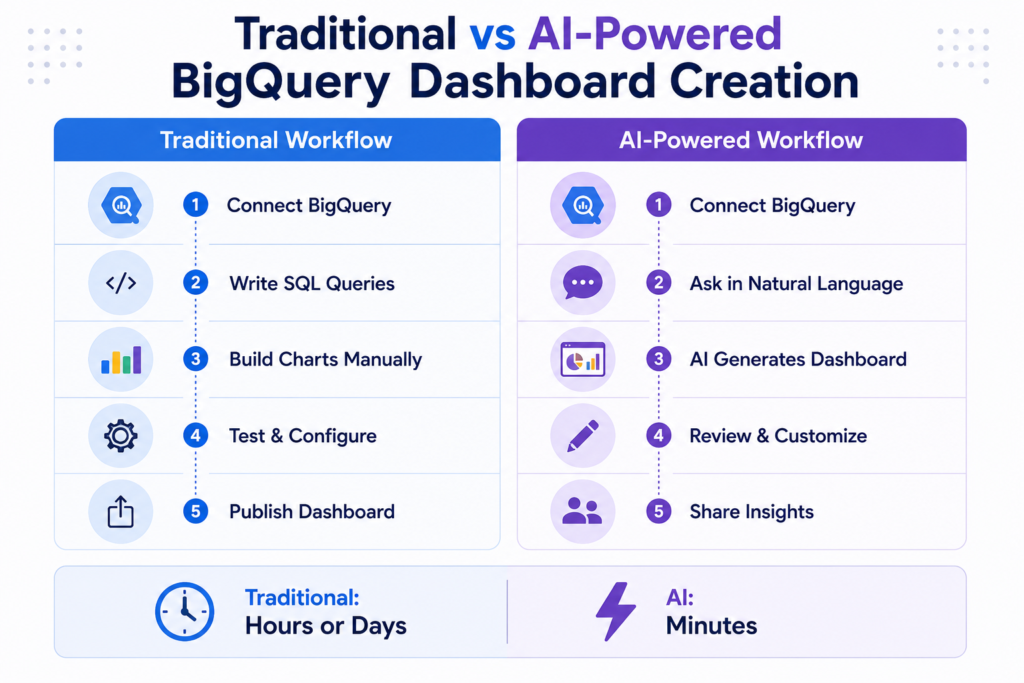
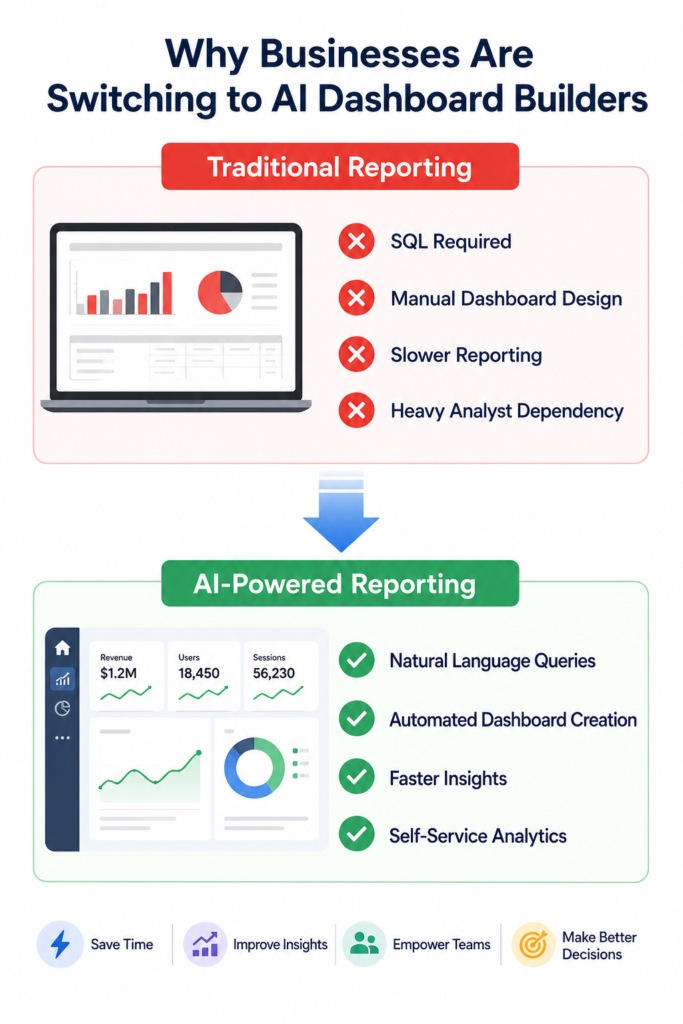
As the comparison shows, traditional dashboard creation often involves manual SQL queries, chart configuration, and ongoing maintenance.
AI-powered dashboard builders automate many of these tasks, helping teams create dashboards faster and spend more time analyzing insights instead of building reports.
The following comparison highlights the key differences between traditional dashboard creation and AI-powered dashboard builders.
| Feature | Traditional BigQuery Dashboard | AI-Powered BigQuery Dashboard |
|---|---|---|
| SQL Knowledge | Required | Minimal or Not Required |
| Dashboard Creation | Manual | AI-Assisted |
| Setup Time | Hours or Days | Minutes |
| Report Updates | Manual | Automated |
| Technical Expertise | High | Low |
| Best For | Technical Teams | Business & Technical Teams |
Why Are Businesses Switching to AI-Powered BigQuery Dashboards?
As businesses generate larger volumes of data, traditional dashboard creation becomes increasingly difficult to manage. Teams need faster access to insights without spending hours writing SQL queries or manually building reports.
Automate Dashboard Creation with AI
AI-powered dashboard builders simplify the reporting process by automatically generating dashboards and visualizations from natural language prompts.
This reduces manual work and enables both technical and non-technical users to explore data more efficiently.
Turn BigQuery Data into Actionable Insights Faster
Instead of spending time building reports, teams can focus on interpreting data and making informed business decisions.
Faster dashboard creation means quicker access to real-time insights for operations, finance, marketing, and product teams.
Example: Turning Business Data into Actionable Insights
Imagine a company storing sales, marketing, and customer data in BigQuery. Instead of exporting spreadsheets or waiting for analysts to build reports, the team connects BigQuery to an AI-powered dashboard builder.
Within minutes, they can monitor revenue, campaign performance, customer acquisition costs, and operational KPIs from a single interactive dashboard.
As new data is added to BigQuery, the dashboard updates automatically, helping teams identify trends and make informed decisions faster.
Build BigQuery Dashboards with Papercrane
With Papercrane, you can connect your BigQuery data, generate interactive dashboards in minutes, customize visualizations, and share insights across your organization, all without the complexity of traditional dashboard development.
This helps reduce reporting time, improve collaboration, and make data-driven decisions with greater confidence.
Use Cases for BigQuery Dashboards Across Different Teams
While the dashboard itself is built on the same data source, each department can customize it to monitor the metrics most relevant to its objectives.
This enables faster reporting, improved collaboration, and more informed decision-making across the business.
Marketing Teams
Marketing teams can use BigQuery dashboards to monitor campaign performance, website traffic, lead generation, customer acquisition costs, and return on investment (ROI). Having these metrics in one place makes it easier to optimize campaigns and identify opportunities for growth.
Sales Teams
Sales dashboards provide real-time visibility into revenue, sales pipelines, conversion rates, and regional performance. Teams can quickly identify trends, track targets, and make data-driven decisions without manually compiling reports.
Finance Teams
Finance departments can monitor budgets, expenses, revenue, cash flow, and profitability through interactive dashboards. Automated reporting reduces manual spreadsheet work and helps maintain accurate financial oversight.
Operations and Product Teams
Operations and product teams can track system performance, customer behavior, product adoption, and operational KPIs. Real-time visibility helps identify bottlenecks, improve efficiency, and support continuous business improvement.
Build BigQuery Dashboards Faster with Papercrane
Building a BigQuery dashboard doesn’t have to involve complex SQL queries, lengthy setup, or manual reporting.
With Papercrane, you can connect your BigQuery data, generate interactive dashboards using natural language, and customize visualizations in minutes.
Whether you’re tracking sales, marketing, finance, or operational performance, Papercrane helps your team turn BigQuery data into actionable insights, without relying on technical experts for every report.
Ready to build BigQuery dashboards without SQL? Explore Papercrane today.
Also comparing cloud data warehouses? Read our BigQuery vs Snowflake comparison to understand the differences in performance, scalability, and analytics capabilities before choosing the right platform.
FAQs
What is a BigQuery dashboard?
A BigQuery dashboard is a visual reporting interface that displays data stored in Google BigQuery using charts, graphs, tables, and KPIs. It helps businesses analyze data and make informed decisions without reviewing raw datasets.
Can I build a BigQuery dashboard without SQL?
Yes. AI-powered dashboard builders allow you to connect your BigQuery data and create dashboards using natural language prompts instead of writing SQL queries, making analytics more accessible to non-technical users.
Which tools can be used to build BigQuery dashboards?
Businesses commonly use tools such as Looker Studio to create a BigQuery Data Studio dashboard, Power BI, Tableau, and AI-powered dashboard builders.
Can BigQuery dashboards display real-time data?
A BigQuery real-time dashboard can display near real-time data when connected to updated datasets.
Google Cloud also supports streaming data into BigQuery, allowing new records to become available for analysis within seconds, depending on the ingestion method.
Why should businesses use AI-powered dashboard builders?
AI-powered dashboard builders automate dashboard creation, reduce manual work, and make data accessible through natural language queries. This helps teams generate insights faster, improve collaboration, and reduce reliance on technical resources.