How to Build a MongoDB Dashboard Without Aggregation Pipelines
July 26, 2026
·
Tim Liu
Your MongoDB database has millions of documents. Your stakeholders want a dashboard by Monday. Your developer is in the middle of a sprint.
And the last time someone tried to build one, they spent three days tangled in aggregation pipelines ($group, $lookup, $unwind), only to end up with a broken chart that nobody understood.
Sound familiar?
Fortunately, building a MongoDB dashboard no longer has to rely on complex aggregation pipelines.
Modern AI-powered tools make it possible to visualize MongoDB data using plain language, helping teams create interactive dashboards faster.
What Is a MongoDB Dashboard?
A MongoDB dashboard is a visual interface that connects to a MongoDB database and displays data as charts, graphs, tables, and key performance indicators (KPIs).
It helps users monitor business metrics, analyse trends, and make data-driven decisions without manually querying the database each time they need insights.
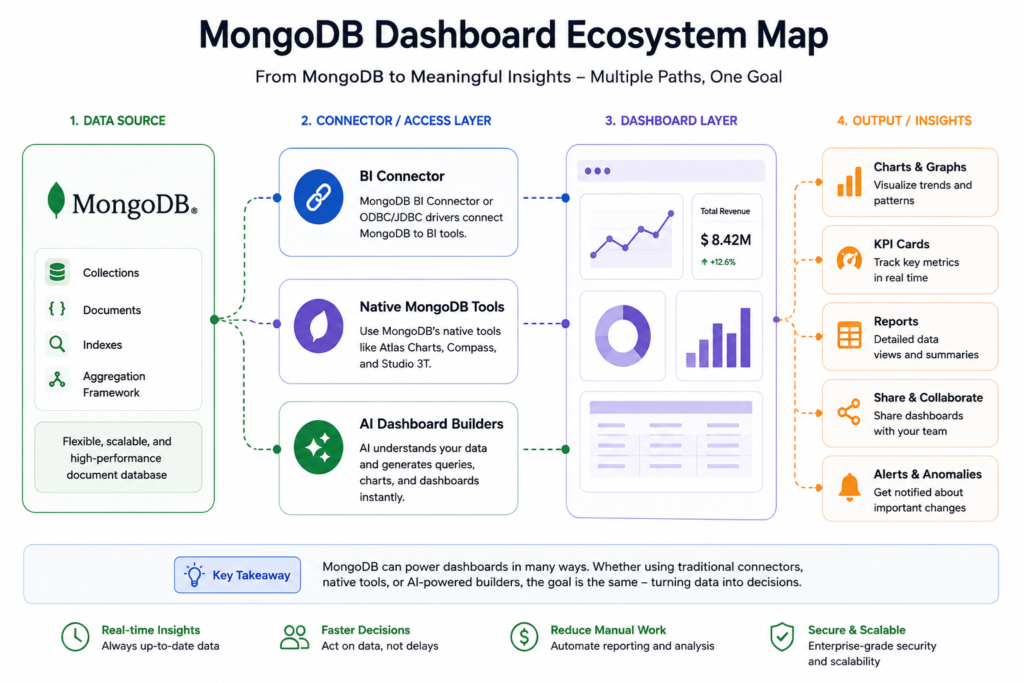
Why MongoDB Dashboards Rely on Aggregation Pipelines
An MongoDB aggregation pipeline is MongoDB’s built-in mechanism for processing and transforming data. It works in stages, each stage takes documents in, transforms them, and passes results to the next stage. Common stages include:
$match: filter documents (like a WHERE clause)$group: group documents and calculate totals, averages, counts$project: reshape documents, keep or exclude fields$sort: order results$lookup: join data from another collection
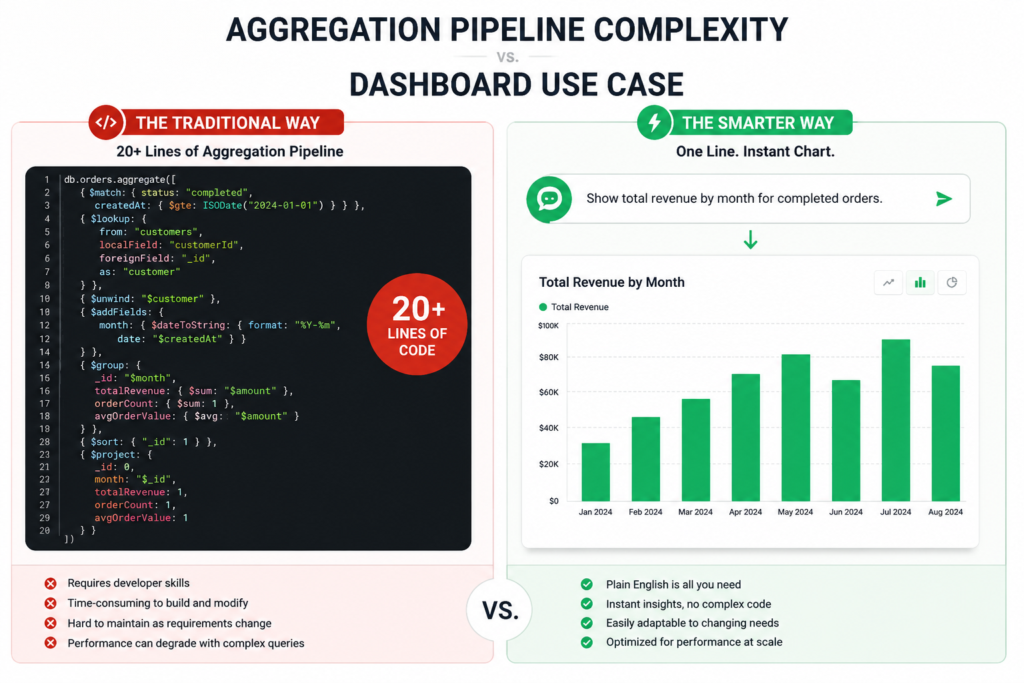
In theory, this is elegant and powerful. In practice, for a product manager trying to build a dashboard showing revenue by month, it looks like this:
db.orders.aggregate([
  { $match: { status: "completed", createdAt: { $gte: ISODate("2024-01-01") } } },
  { $group: {
      _id: { $dateToString: { format: "%Y-%m", date: "$createdAt" } },
      totalRevenue: { $sum: "$amount" },
      orderCount: { $sum: 1 }
  }},
  { $sort: { "_id": 1 } }
])
That’s the simple version, a single collection, a single metric, no joins. Add a second collection, a conditional calculation, or a nested array, and you’re looking at 20-40 lines of JSON syntax.
As reporting requirements expand, teams typically face three common challenges.
Developer Dependency
Every new dashboard or reporting request often requires developer involvement. Business users can’t easily modify aggregation pipelines, so even minor reporting changes compete with product development priorities.
Keeping Dashboards Up to Date
As collections evolve, existing pipelines need updating to reflect new fields, document structures, or business logic. Managing multiple pipelines across dashboards increases maintenance effort and the risk of inconsistent reports.
Performance Challenges
Complex pipelines that rely on stages such as $lookup and $group can become resource-intensive on large collections. Without careful optimisation, dashboard queries may take longer to execute, affecting real-time reporting and user experience.
How to Build a MongoDB Dashboard Without Aggregation Pipelines
Here’s where things change. AI-powered dashboard builders like PaperCrane. Take a fundamentally different approach to MongoDB dashboard creation. Instead of making you learn query syntax, they let you describe what you want to see and handle the data retrieval automatically.
No aggregation pipelines. No BI Connector. No ODBC drivers. No developer dependency.
Here’s how it works, step by step.
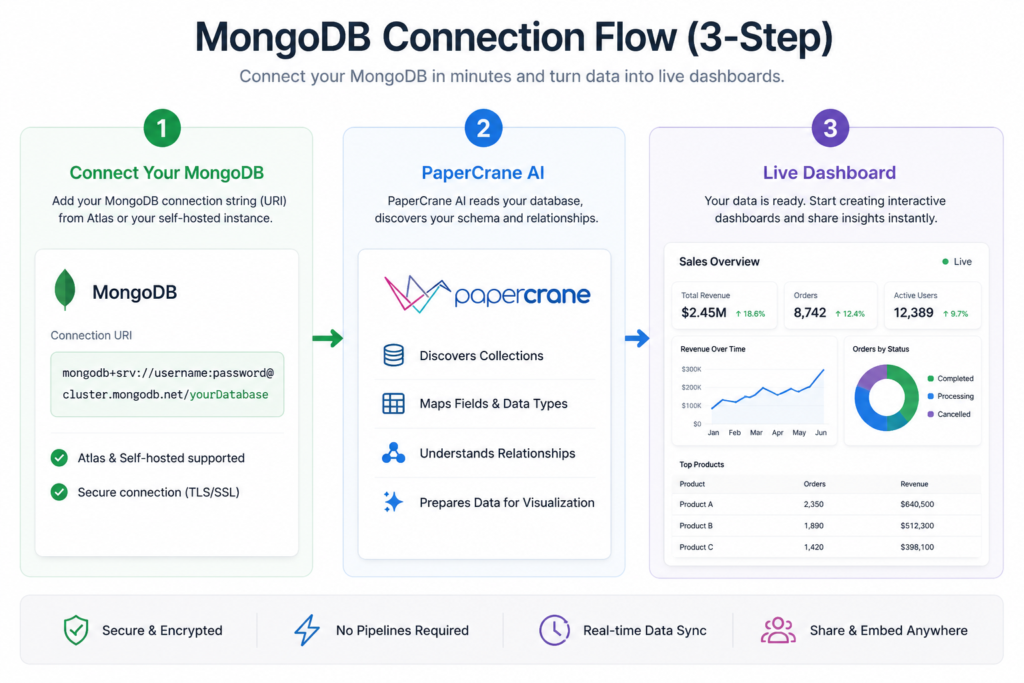
Step 1: Connect Your MongoDB Database
Connect your MongoDB Atlas or self-hosted database using its connection string (URI). The dashboard builder automatically detects your collections, field types, and document structure, eliminating the need for manual schema configuration.
Connect your MongoDB database to PaperCrane
Step 2: Select Your Collections
Choose the collections you want to analyse, such as orders, users, events, or support tickets. You can combine data across multiple collections without manually creating $lookup stages or aggregation pipelines.
Step 3: Build With AI Dashboard Builder
Describe the dashboard you want in plain English, such as “Show monthly revenue” or “Display daily active users.” The AI generates the required query, retrieves the data, and creates a live MongoDB dashboard with the most suitable visualisation.
Step 4: Customise and Share
Add charts, KPIs, filters, and tables, then share your MongoDB analytics dashboard with your team or embed it into your applications. Your dashboards stay connected to MongoDB and refresh automatically with the latest data.
MongoDB Charts Alternative: When to Use Native Tools vs. an AI Dashboard Builder
Not every team has the same needs. The right MongoDB reporting tool depends on your technical context, your team structure, and what you’re trying to accomplish.
Here’s a comparison.
| Feature | MongoDB Charts | Tableau + BI Connector | AI Dashboard Builder (PaperCrane) |
|---|---|---|---|
| Works without Atlas | ❌ No | ✅ Yes (with driver) | ✅ Yes |
| Requires aggregation pipelines | Partially | ❌ Yes (via SQL translation) | ❌ No |
| Non-technical user friendly | Moderate | ❌ No | ✅ Yes |
| Cross-collection joins | ❌ Limited | ✅ Yes | ✅ Yes |
| Setup time | Minutes (Atlas only) | Hours to days | Minutes |
| Preserves nested document structure | ✅ Yes | ❌ Flattened | ✅ Yes |
| Real-time data | ✅ Yes | Delayed | ✅ Yes |
| Natural language queries | ❌ No | ❌ No | ✅ Yes |
| Works on self-hosted MongoDB | ❌ No | ✅ Yes | ✅ Yes |
MongoDB Dashboard Use Cases
A MongoDB dashboard helps different teams turn operational data into actionable insights. Common use cases include:
SaaS Product Analytics
Track daily and monthly active users, feature adoption, onboarding funnels, churn risk, and revenue by subscription plan with a MongoDB analytics dashboard.
E-commerce Operations
Monitor order volume, sales performance, inventory, cart abandonment, fulfilment status, and customer trends through real-time MongoDB visualization.
IoT and Sensor Monitoring
Visualize time-series data, device health, sensor readings, uptime, and anomaly detection to monitor connected systems at scale.
Customer Support
Measure open tickets, response and resolution times, agent performance, escalation rates, and SLA compliance with live dashboards.
Internal Business Reporting
Track finance, HR, operations, and project KPIs in one place. Instead of manually querying the database, teams can visualize MongoDB data and access up-to-date reports whenever they need them.
FAQs
What is a MongoDB dashboard?
A MongoDB dashboard displays MongoDB data as charts, tables, KPIs, and graphs, helping teams monitor performance and make faster decisions.
Can you build a MongoDB dashboard without writing code?
Yes. AI-powered tools let you build a MongoDB dashboard using plain English instead of aggregation pipelines, SQL, or custom code.
What is the best MongoDB dashboard tool for non-technical users?
AI-powered dashboard builders are the easiest option because they automatically visualize MongoDB data without requiring query or BI expertise.
Can Tableau or Power BI connect to MongoDB?
Yes. Both connect through the MongoDB BI Connector, but setup, schema translation, and ongoing maintenance add complexity.
What is the difference between MongoDB Charts and the BI Connector?
MongoDB Charts is a native visualisation tool, while the BI Connector translates MongoDB data for SQL-based BI platforms like Tableau and Power BI.
What are the limitations of MongoDB Charts?
MongoDB Charts supports Atlas only, offers limited customisation, and lacks natural language queries and advanced cross-collection reporting.
Is MongoDB Charts free?
MongoDB Charts is included with MongoDB Atlas but isn’t available for self-hosted MongoDB deployments. Atlas usage costs still apply.
Build Smarter MongoDB Dashboards with PaperCrane
MongoDB is excellent for storing document-based data, but turning that data into business insights often requires complex reporting workflows.
Instead of relying on aggregation pipelines, BI connectors, or manual exports, PaperCrane lets you connect your database and create a live MongoDB dashboard using natural language.
If your team also stores data in PostgreSQL alongside MongoDB, you might find our guide on building a PostgreSQL dashboard equally useful.