White Label Dashboard for Agencies: Stop Rebuilding Client Reports
August 11, 2026
·
Tim Liu
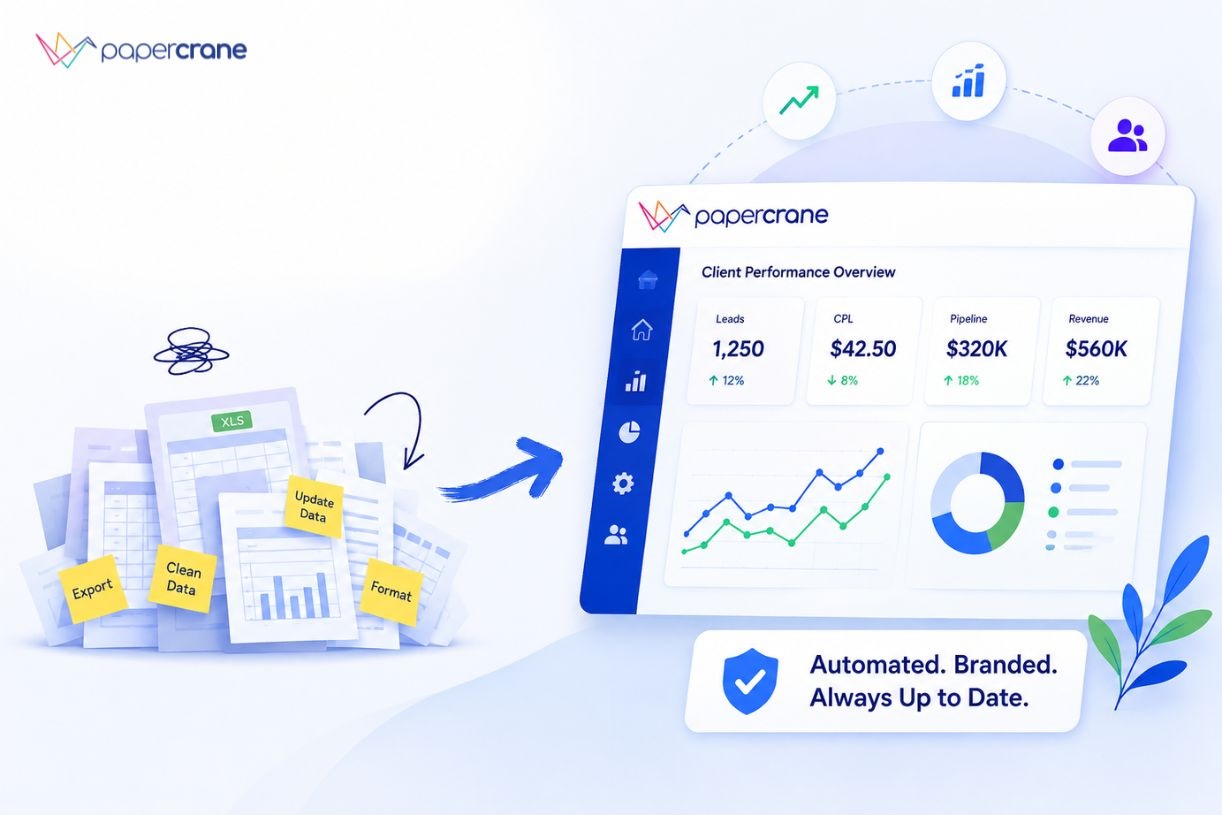
The client work is done. The reporting work shouldn’t take another few hours.
Your team pulls Google Ads data, checks GA4, exports CRM numbers, updates charts, applies agency branding, writes the summary, and sends the report. Then the next client needs a different set of metrics.
As your client list grows, reporting becomes another production workload.
A better white label dashboard should support automated client reporting, reduce the work behind each account, and give clients a professional, branded way to access their data.
What Should You Expect From a White Label Dashboard?
A white label dashboard is a client-facing reporting dashboard presented under your agency’s branding rather than the software provider’s branding.
For an agency, white labeling should cover more than a logo. The reporting system should support:
- Your agency branding
- Custom domains
- Client-specific access
- Multiple data sources
- Automated data refreshes
- Reusable dashboard structures
- Secure sharing
- Flexible reporting requirements
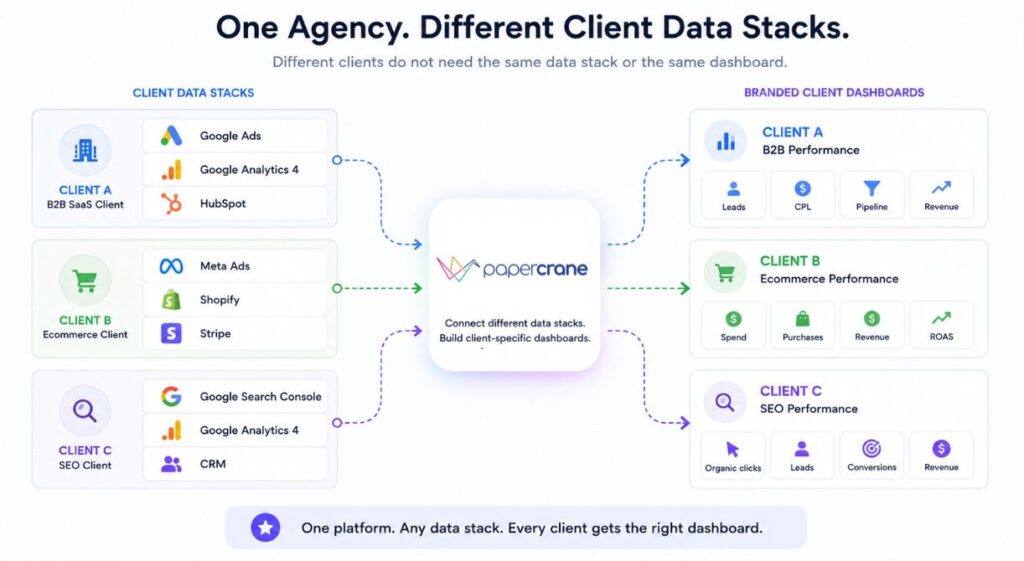
Consider an agency managing three accounts:
| Client | Data sources | Main KPIs |
|---|---|---|
| B2B SaaS | Google Ads, GA4, HubSpot | Leads, CPL, pipeline, ROAS |
| Ecommerce | Meta Ads, Shopify, Stripe | Revenue, purchases, ROAS |
| SEO | Search Console, GA4, CRM | Organic traffic, leads, revenue |
Good client dashboard software lets the agency present each account under its own brand without forcing every client into the same reporting structure.
The key distinction is simple. White labeling solves the client-facing experience. The reporting platform behind it still needs to reduce the work required to create and maintain those dashboards.
Where Most Agency Reporting Tools Stop Short
A reporting template works well until the client asks for something outside the template.
A PPC client might need:
- Spend
- CPC
- CPL
- Conversion rate
- ROAS
An SEO client needs a different set:
- Organic clicks
- Impressions
- Rankings
- Organic conversions
- Revenue
Then a client adds a CRM and asks:
“Can you show pipeline revenue by campaign?”
Now the reporting workflow needs another change.
The same issue appears when agencies work across different platforms. One client uses Google Ads and HubSpot. Another uses Meta and Shopify. Another has a PostgreSQL database containing its core revenue data.
The challenge becomes less about creating a report and more about adapting the reporting system to each client’s business.
Why Papercrane Fits Agencies With Different Client Data
Agencies rarely work with one standard data stack.
A B2B lead generation agency might connect:
Google Ads + GA4 + HubSpot
Its dashboard might show:
- Ad spend
- Leads
- Qualified leads
- CPL
- Pipeline
- Revenue
An ecommerce agency might connect:
Google Ads + Meta Ads + Shopify + Stripe
Its dashboard might focus on:
- Ad spend
- Purchases
- Revenue
- ROAS
- Average order value
- Customer revenue
An SEO agency might combine:
Search Console + GA4 + CRM
Its reporting could focus on:
- Organic clicks
- Organic sessions
- Target queries
- Leads
- Revenue
Papercrane supports 100+ data connectors and also supports building your own integrations.
The value isn’t the number of connectors alone. It is the ability to build reporting around the client’s actual data instead of forcing every account into one template.
See Papercrane’s integrations and dashboard platform
Build the Dashboard Around the Client, Not the Template
This is where AI changes the reporting workflow.
Instead of starting with a fixed dashboard and modifying every component manually, your team describes what the client needs.
For example, an agency connects Google Ads and HubSpot and asks:
“Create a client dashboard showing monthly ad spend, leads, cost per qualified lead, pipeline generated, and ROAS. Compare the last 90 days with the previous period.”
Then the agency can refine the request:
“Add campaign-level performance and highlight campaigns with falling conversion rates.”
Then:
“Add a summary of the three biggest changes this month.”
Papercrane handles data modelling, queries, and visualisation from plain-language requests, so your team doesn’t need SQL knowledge to create the dashboard.
This changes the workflow from building every report component manually to describing the reporting outcome you need.
To read example of a channel-specific dashboard, see our Google Ads Dashboard guide.
Give Clients a Branded Reporting Experience
The dashboard itself is only part of the client experience.
Your agency also needs control over how clients access and interact with reporting.
Papercrane’s Pro plan includes custom domains and removal of Papercrane branding. Enterprise adds features such as unlimited dashboards and team members, SSO, embedded analytics, and per-tenant isolation.
This matters when reporting becomes part of your agency’s service.
For example, instead of sending a client to a third-party reporting environment, your agency can provide a branded reporting portal under your own domain.
The client sees the agency’s reporting environment, while your team manages the underlying dashboards and data connections.
For agencies selling ongoing analytics or reporting services, this creates a more consistent experience from onboarding through monthly performance reviews.
What Happens When a Client Asks for Something New?
This is where reporting workflows often become expensive.
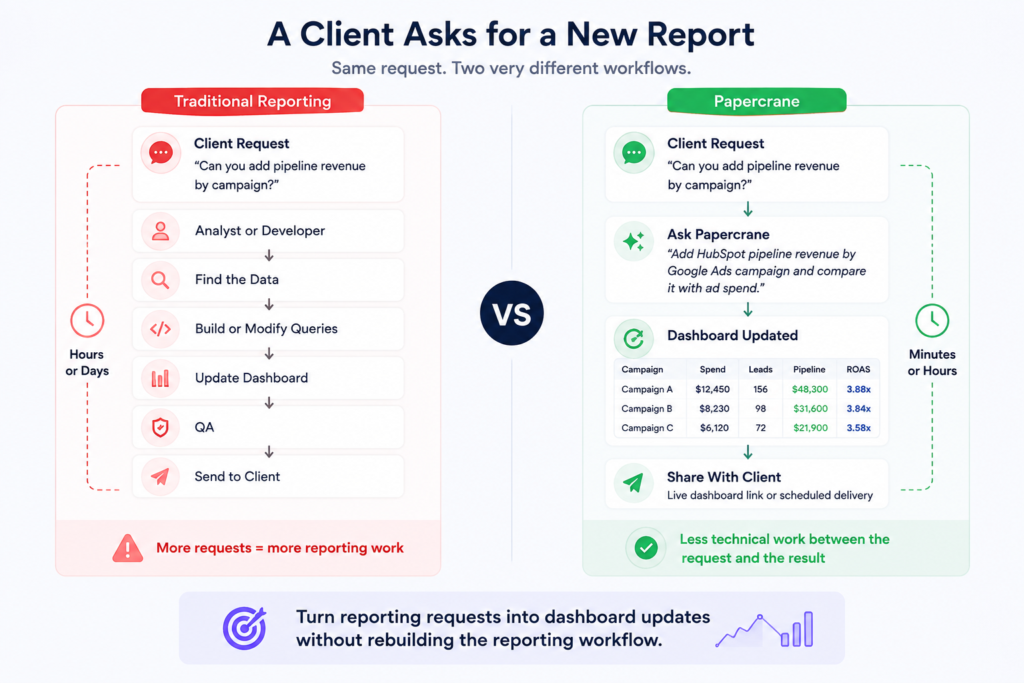
A client asks:
“Can you add pipeline revenue by Google Ads campaign?”
A traditional workflow might look like:
Client request → Analyst → Data extraction → Dashboard modification → QA → Client
Another request arrives:
“Can we compare this quarter with last year?”
The process starts again.
With an AI dashboard workflow, the agency can ask for the new view directly:
“Add HubSpot pipeline revenue by Google Ads campaign and compare it with advertising spend.”
The reporting system handles the technical work while the agency decides what the client should see and why it matters.
The point isn’t to remove your agency’s expertise. It is to reduce the technical work required to turn a reporting request into a useful dashboard.
Traditional:
Request → Analyst → Data work → Dashboard update → QA → Client
Papercrane:
Request → Ask → Dashboard update → Client
This visual directly addresses a major agency concern, reporting turnaround time.
Build Client Dashboards Around Business Outcomes
A client doesn’t need 40 charts. They need answers.
For paid media, don’t lead with impressions and clicks if the client’s goal is lead generation.
Lead with:
Leads → Qualified leads → CPL → Pipeline → Revenue
Then use supporting metrics such as:
- Impressions
- Clicks
- CPC
- Conversion rate
For SEO, the primary story might be:
Organic traffic → Leads → Qualified leads → Revenue
Search Console performance data provides metrics such as clicks, impressions, CTR, and average position, which agencies can use as supporting evidence for SEO performance.
For ecommerce:
Ad spend → Purchases → Revenue → ROAS
Then show:
- CPC
- CTR
- Conversion rate
- Average order value
Google Analytics reports also help to investigating traffic, users, and website or app activity.
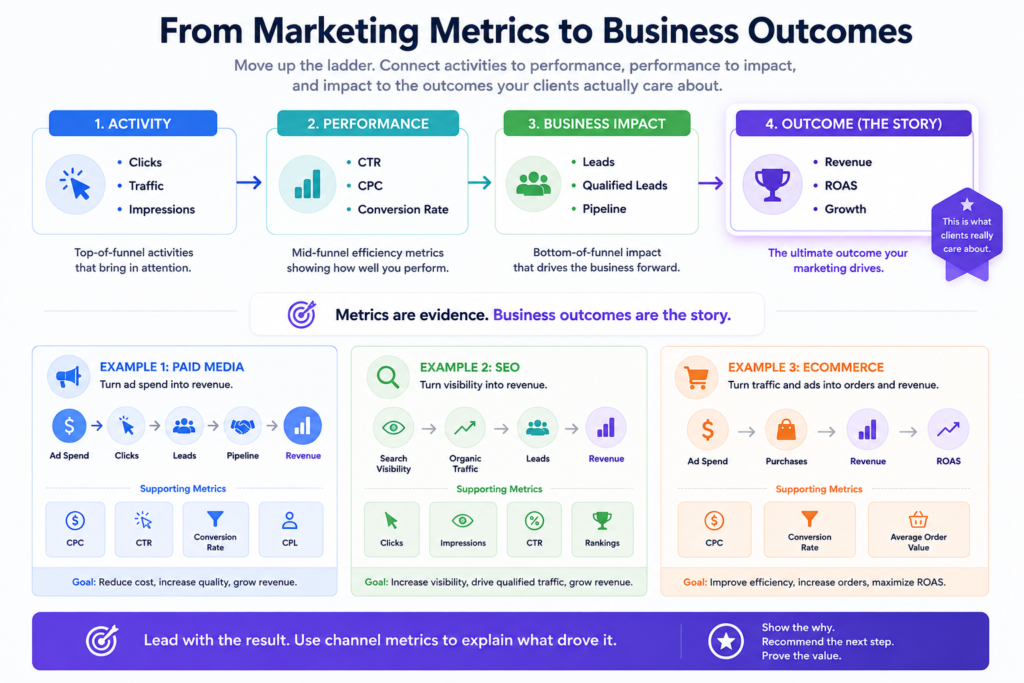
The dashboard becomes more useful when it follows a clear sequence:
Business outcome → Performance driver → Channel detail → Next action
Example:
Clicks → Leads → Qualified Leads → Pipeline → Revenue
and
Ad Spend → Conversions → ROAS
White Label Dashboard vs PDF Client Report
A white label dashboard and a PDF report serve different purposes.
| White Label Dashboard | PDF Report |
|---|---|
| Live data | Fixed snapshot |
| Ongoing access | Scheduled delivery |
| Interactive | Static |
| Client can explore | Limited exploration |
| Data refreshes automatically | Needs regeneration |
| Useful between meetings | Useful for formal summaries |
For example, a monthly PDF might tell a client:
“Google Ads generated 184 leads in July.”
A live dashboard lets the client answer follow-up questions:
- Which campaigns generated those leads?
- How did CPL change?
- How did July compare with June?
- Which campaigns generated pipeline?
- What happened after budget changes?
A PDF still has value for formal monthly or quarterly communication. A dashboard becomes more useful when clients need access between meetings.
When Papercrane Is Right for Your Agency
You should go for Papercrane if your agency:
- Manages clients across different data platforms
- Builds custom dashboards for different accounts
- Spends significant time modifying reports
- Relies on spreadsheets or manual exports
- Wants branded client-facing dashboards
- Combines marketing data with CRM, ecommerce, finance, or database data
- Wants teams to create dashboards without waiting for developers or analysts
For example, an agency with 30 clients might have Google Ads and GA4 for one account, Meta and Shopify for another, and Search Console, GA4, and a CRM for a third.
A flexible reporting system becomes more valuable as these combinations grow.
If every client uses the same three metrics and the same reporting format, a template-based reporting platform might meet your needs more efficiently.
The decision comes down to how much variation exists across your client accounts and how much work your team spends supporting it.
What Does Papercrane Cost for an Agency?
Papercrane has three plans.
Free: Up to 5 dashboards, one user, 100+ connectors, custom integrations, and shareable public links.
Pro: $50 per month, up to 20 dashboards, up to 5 team members, custom domains, and removal of Papercrane branding.
Enterprise: Custom pricing, with unlimited dashboards and team members, SSO, private network connectivity, embedded analytics, per-tenant isolation, and additional enterprise controls.
AI usage is billed through credits. Papercrane states that a dashboard typically costs around $0.30 to $0.60 to generate, with smaller updates costing less.
Stop Rebuilding Client Reports
Your next client shouldn’t require another reporting workflow from scratch.
Connect the client’s data sources. Ask for the dashboard you need. Refine it as requirements change. Apply your agency’s branding. Share it with the client.
The result is a reporting process built around the agency’s workflow rather than another collection of fixed templates.
If your team spends too much time assembling, modifying, and maintaining client reports, Papercrane gives you a different approach.
See how Papercrane works for agencies
FAQs
Is Papercrane a white label dashboard platform?
Yes. Papercrane’s Pro plan includes custom domains and removal of Papercrane branding. Enterprise adds customer-facing embedded analytics and per-tenant isolation.
How does Papercrane handle different client data sources?
Papercrane supports 100+ data connectors and allows teams to build their own integrations.
Do I need SQL to build Papercrane dashboards?
No. Papercrane states that users describe what they want to see in plain language while its AI handles data modelling, queries, and visualisation.
Can agencies create different dashboards for each client?
Yes. Each dashboard can be built around the client’s data sources, KPIs, reporting requirements, and access needs.
Does Papercrane support custom domains?
Custom domains are included in the Pro and Enterprise plans.
Is Papercrane suitable for every agency?
It fits agencies with varied client data, custom reporting requirements, and recurring dashboard work. Agencies with identical reporting requirements across every client might prefer a simpler template-based reporting workflow.