How Much Traffic Is Your GA4 Actually Missing? I Built a Dashboard to Find Out
July 22, 2026
·
Tim Liu

Cloudflare says the site served 5,080 requests last week. GA4 says 2,461 pageviews. Same seven days, same ten pages, and the two most trusted tools in the stack disagree by more than double.
Everyone who works with analytics knows GA4 doesn’t capture everything. Ad blockers, bots, consent banners, and Safari’s tracking protections all take their bite. What almost nobody has seen is their own number, because the data that would reveal it doesn’t live in your analytics tool. It lives in your CDN, and most teams never put the two side by side.
I’ve spent countless hours trying to coax GA4 into telling me more about who it isn’t tracking. This isn’t an academic itch. Attribution runs on this data, and whether a lead gets counted as an MQL or an SQL can literally be the difference in whether someone gets paid. If a meaningful slice of your visitors never makes it into the funnel data at all, you’re making those calls with a partial picture and no idea how partial it is.
So I finally measured it. I connected Cloudflare and GA4 to the same dashboard and compared them page by page. The build took about ten minutes using Claude Code and Papercrane. This post walks through the exact steps and prompts so you can run the same comparison on your own site. I recorded the whole thing too, so if you’d rather watch than read, the video is below.
One disclosure before we get into it: the site in this post isn’t mine. It belongs to a friend who gave me permission to wire up its analytics, and I’ve blanked out identifying details in the screenshots.
Why GA4 can’t see everything
GA4 counts a pageview when a piece of JavaScript executes in a visitor’s browser and successfully phones home to Google. Cloudflare counts a request when it passes through the edge on its way to your server. That difference sounds small. It isn’t.
Anything that prevents the JavaScript from running, or from reporting back, vanishes from GA4 entirely: browsers with ad blockers, visitors who bounce before the tag loads, clients with JavaScript disabled, and every bot and crawler that fetches your pages without rendering them. Cloudflare sees all of it, because you can’t request a page without going through the edge. Cloudflare’s own documentation is upfront about this, and their community forums regularly see reports of 3x to 4x discrepancies between the two.
The scale of the invisible traffic is bigger than most people assume. The 2025 Bad Bot Report found that bots made up 53% of all web traffic, the second year in a row that automated traffic outnumbered humans. On the human side, ad blockers hide GA4 from roughly 5 to 15% of general audiences, and Plausible measured blocking rates as high as 58% on tech-savvy audiences. The blocked segment skews technical and higher income, which for a lot of businesses means the most valuable visitors are the least visible ones.
None of this makes GA4 wrong. It makes GA4 one witness with one vantage point. The interesting question is how far its testimony diverges from the raw record, and that ratio is knowable if you look.
The setup
My tool for this was Papercrane, which builds live dashboards through Claude Code. Setup is a single prompt:
Read https://papercrane.ai/get-started and install and loginClaude reads the page, installs the CLI, and opens the login flow in the browser. From there I connected the two data sources by asking for them. “Connect google analytics” pops a standard Google OAuth window. “Now connect cloudflare” starts the Cloudflare flow, which needs one manual step: creating an API token in the Cloudflare dashboard.
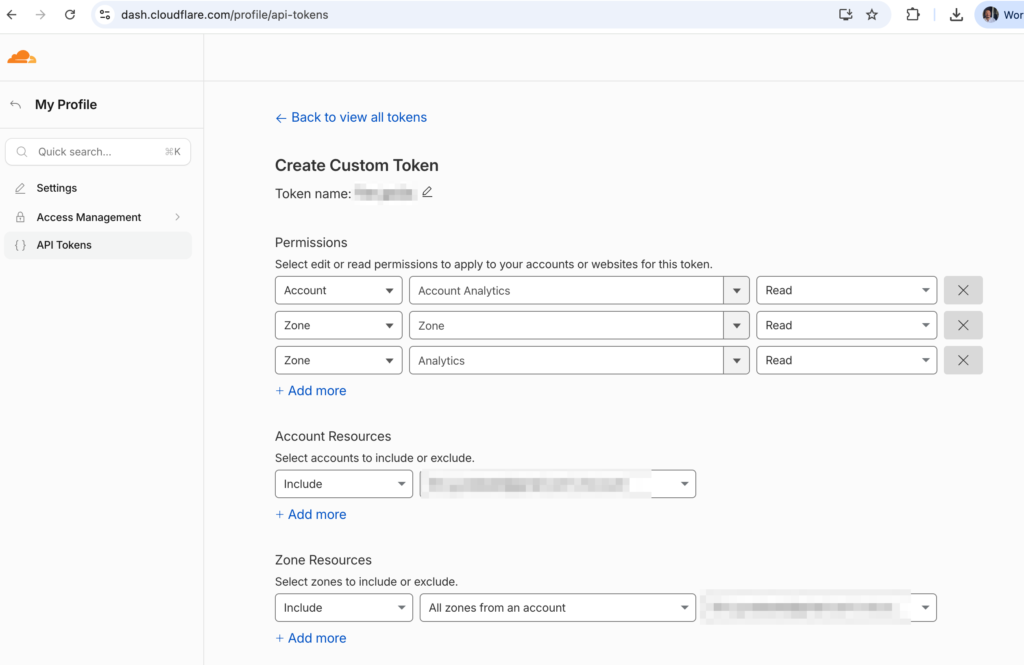
The token needs Read access for three permission scopes: Account: Account Analytics, Zone: Zone, and Zone: Analytics. Make sure it also includes the right account and zone under Account Resources and Zone Resources, or the queries will come back empty. Claude verified the connection worked by listing the zones it could see before moving on.
The build
Here’s the full dashboard prompt, with the site details swapped for placeholders so you can reuse it:
Build a dashboard to compare Cloudflare requests vs GA4 pageviews for the
top 10 landing pages (exclude "/"), last 7 days, grouped by
America/New_York days.

- Cloudflare: zone <yourdomain.com>. Query httpRequestsAdaptiveGroups via
  cloudflare.schema.query with filters: requestSource "eyeball",
  edgeResponseStatus 200, method GET, exact clientRequestPath. This plan
  caps queries at a 1-day range, so query per day.

- GA4: the property is named "Your GA4 Property"

Once built show me the dashboard in the preview window
The details in that prompt are doing real work, and they’re worth understanding before you run it on your own site.
The Cloudflare filters make the comparison as fair as possible. requestSource "eyeball" restricts the count to requests from actual clients rather than internal Cloudflare traffic, edgeResponseStatus 200 drops errors and redirects, method GET drops form posts and API calls, and matching on the exact path keeps each landing page’s count clean. Without those filters you’d be comparing GA4 pageviews against every asset request and health check that touches the domain, and the gap would look far scarier than it really is.
Comparing landing pages instead of the homepage matters too. Your homepage gets hit by monitoring services, link previews, and every bot that ever learned your domain, so it’s the noisiest possible page to study. Landing pages that earn traffic from search are a much more honest sample. Cloudflare’s free tier also only keeps seven days of history and caps each query at a one-day range. I mentioned that constraint in the prompt, and Claude worked around it on its own by querying day by day and stitching the results together.
After that, I let it work. It read the integration schemas, wrote the queries against both APIs, built the dashboard, and spun up a live preview.

The results
For every hundred requests Cloudflare served across the top ten landing pages, GA4 recorded about 48 pageviews. The daily chart makes the relationship easy to trust: both lines rise and fall together through the week, including a mid-week spike that shows up identically in both sources. When the two lines move in lockstep like that, the spike was real traffic rather than a measurement artifact, and the gap between the lines is structural rather than random.
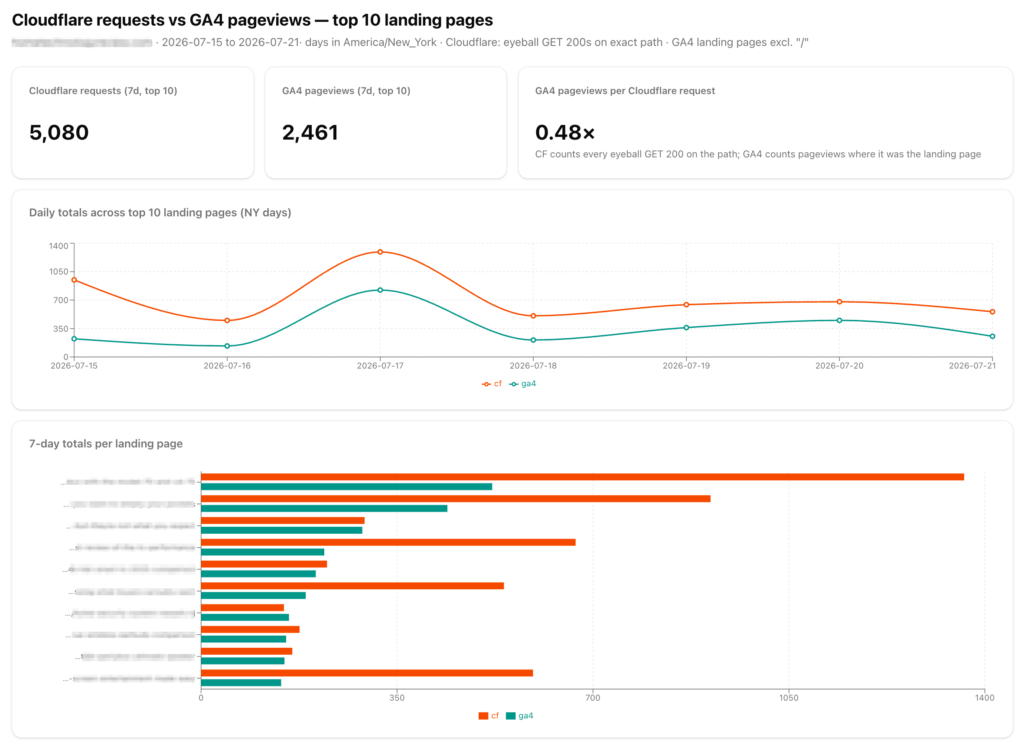
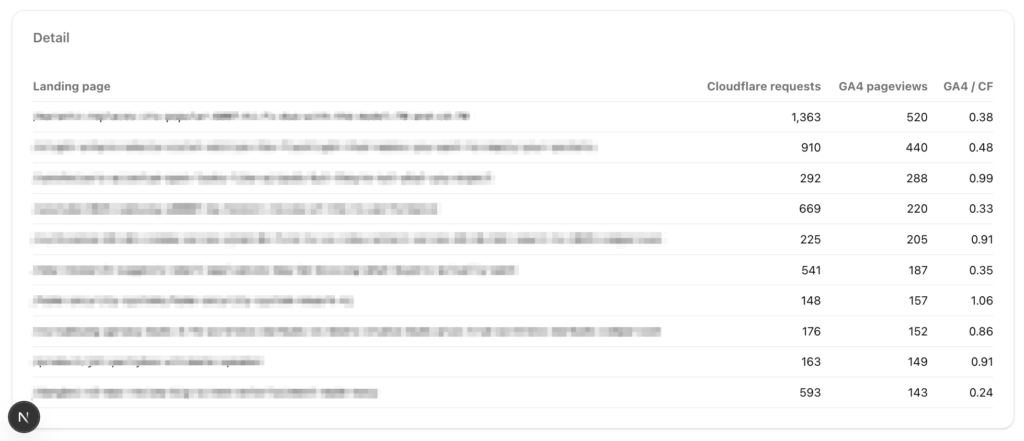
Page by page, the spread was wider than the site-wide number suggests: some pages sat near 0.25, others near parity, and a couple crept above 1.0 (more on that in a moment). Pages where the Cloudflare bar towers over the GA4 bar are getting lots of raw hits that never convert to tracked sessions, which usually points to bot interest, embedded or prefetched requests, or a heavily ad-blocked audience on that topic.
An honest admission about edge cases
Comparing edge data to analytics data is genuinely useful and genuinely full of traps. The two systems were never designed to agree, and I hit several of the traps myself on the first pass. Rather than pretend the number came out clean and authoritative, here’s what to watch for when you run this on your own site:
- A request is not a pageview, even after filtering. The 52% gap is not 52% missed humans. A large share is bots you’d never want in your analytics anyway. The ratio is a directional signal, not a census.
- Paths are messier than they look. GA4 and your CDN can record the same page differently (trailing slashes, redirects, query strings). A page that 301-redirects can make one side of the comparison quietly count near zero.
- GA4 dimensions have scopes, and they bite. Landing page is a session-scoped dimension. Pair it with a pageview count and you’re measuring every page those sessions viewed, not views of that page. For hub pages people click through from, the numbers diverge a lot.
- The gap runs both directions. Some crawlers execute JavaScript, and GA4 counts them as visitors. A single automated browsing session can inflate a page’s numbers enough to make a ratio look impossible.
- If a ratio comes out above 1.0, don’t panic and don’t publish it. A browser can’t fire a pageview without requesting the page, so a number like that means one of the edge cases above is in play. Check the measurement before you conclude anything about the traffic.
I know these because the first version of this dashboard produced one ratio above 1.0, and working out why taught me most of the list. The useful mindset: this dashboard is a flashlight, not a verdict. Site-wide, a ratio around a half sits comfortably in the range the industry numbers above predict. The value over time is watching for pages that drift away from their neighbors, because that drift is how bot swarms, scraper interest, ad-blocker-heavy audiences, and broken instrumentation announce themselves. Every one of those is invisible from inside GA4 alone.
Try it on your site
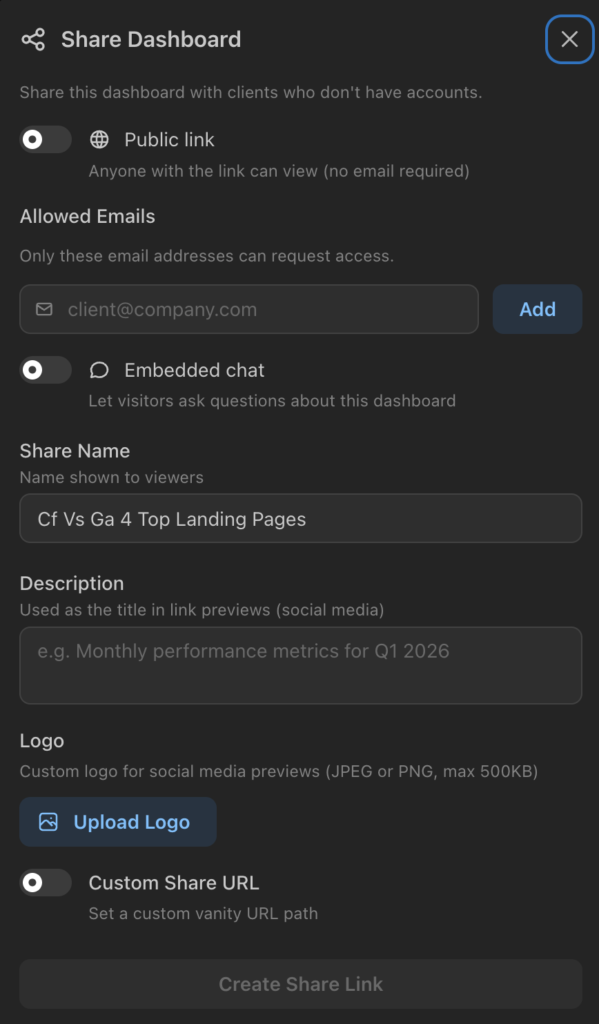
The whole build was three prompts and an API token: install, connect, describe the dashboard. Once it looked right, one more message published it to a live URL that can be shared publicly, locked to specific email addresses, or embedded, with a built-in chat so viewers can ask the dashboard questions directly instead of asking you.
If you’ve ever wondered what percentage of your traffic GA4 actually sees, the answer is sitting in your CDN logs right now. It takes about ten minutes to find out at papercrane.ai. The number I found surprised me. Yours probably will too.