Facebook & Meta Ads Dashboard: Client-Ready Reporting on Autopilot
August 30, 2026
·
Tim Liu
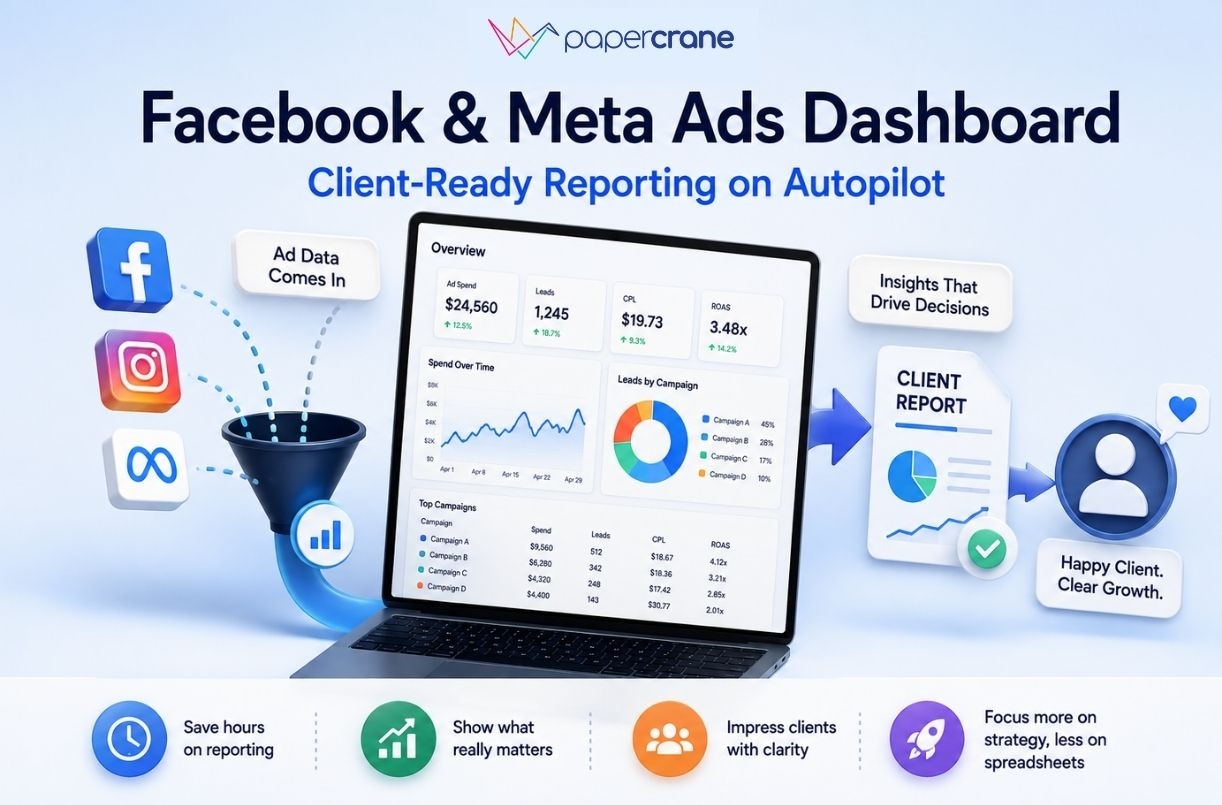
Your Meta Ads campaigns are running. The data is there. The client still wants answers.
Which campaigns generated the best leads? Which ads drove revenue? Why did CPL increase? What changed from last month? Where should the budget move next?
A Facebook Ads dashboard should help answer those questions without turning every client report into another manual project.
For agencies, the problem is rarely a lack of data. It is turning Meta Ads data into a clear client story, then doing it again for every account.
Your Meta Ads Report Has the Numbers. Does It Answer the Client?
Meta Ads Manager gives you a detailed view of advertising performance. You have spend, impressions, clicks, conversions, cost per result and other campaign metrics. Meta also provides reporting and performance data through its advertising tools.
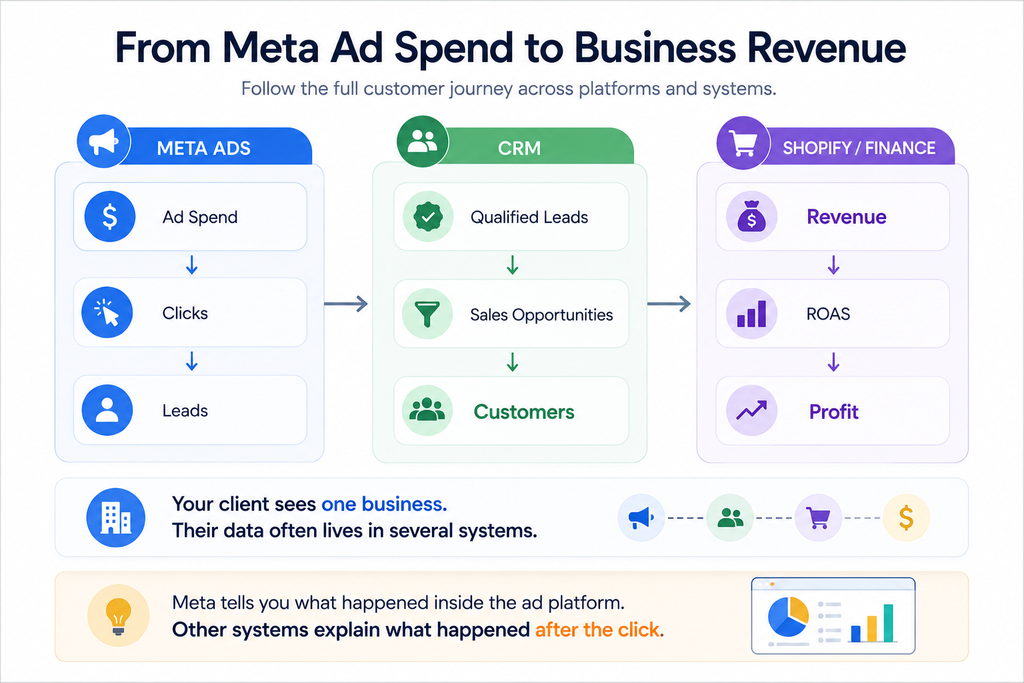
But clients often ask questions beyond those metrics.
They might ask:
- Which campaign generated the most qualified leads?
- Which ads produced customers?
- How did this month’s results compare with last month?
- Which campaigns deserve more budget?
- Did the extra ad spend produce more revenue?
A typical Facebook advertising dashboard might show:
Spend → Clicks → Leads → CPL → ROAS
The client might be thinking:
Spend → Qualified leads → Customers → Revenue
Those are two different reporting needs.
Your job as the agency is to connect them.
Why Facebook Ads Reporting Gets Repetitive for Agencies
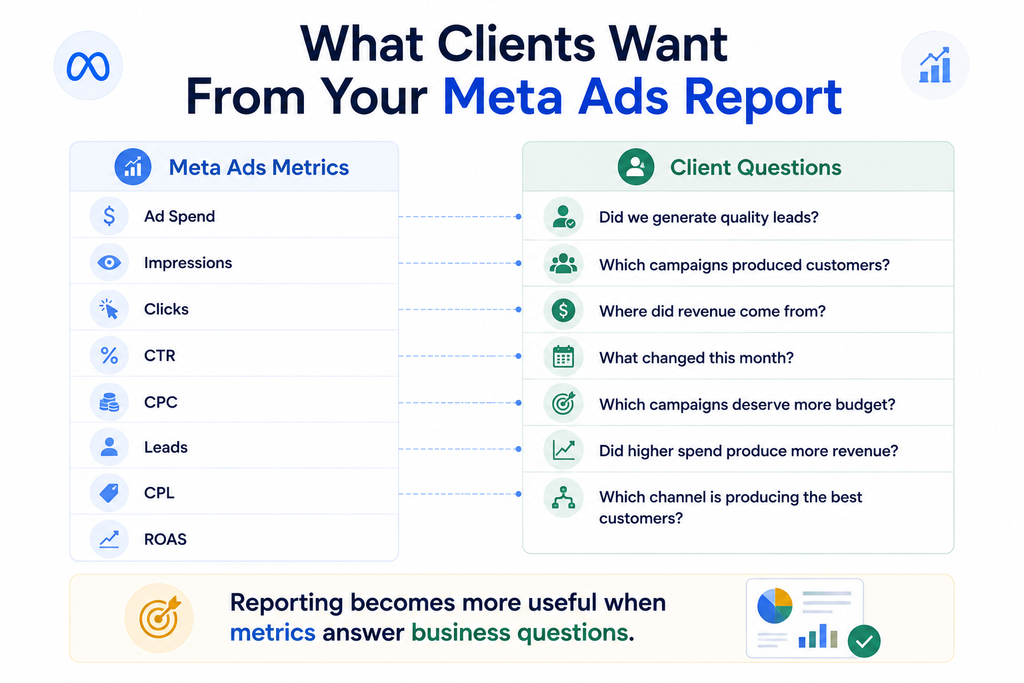
The monthly reporting process often looks simple from the outside.
Open the client’s Meta account.
Select the date range.
Pull the numbers.
Check the previous period.
Update the charts.
Add commentary.
Apply the agency branding.
Export the report.
Send it to the client.
Then do it again.
And again.
One account is manageable. The problem grows when your agency manages 10, 20 or 30 accounts with different goals and different data sources.
A B2B client might care about leads and pipeline.
An ecommerce client might care about purchases and revenue.
A lead generation client might care about qualified leads and cost per acquisition.
The same Facebook Ads report template does not fit all three.
This is why agencies often end up maintaining spreadsheets, dashboards and reporting templates alongside Meta Ads Manager. The reporting itself becomes another recurring production task.
A Facebook Ads Dashboard Still Needs More Than Meta Data
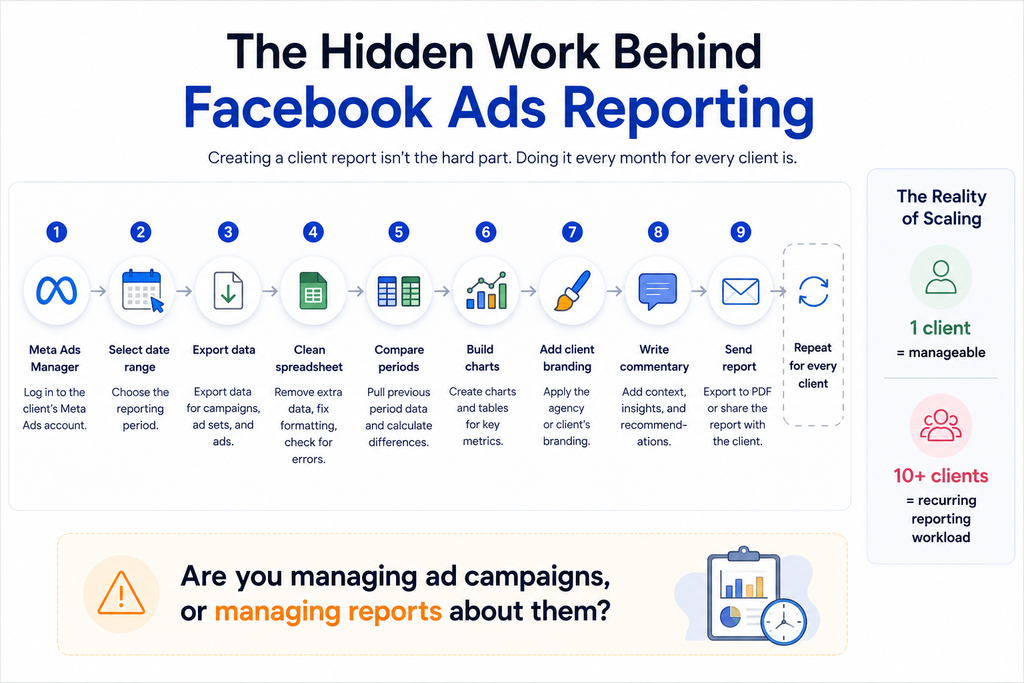
A dashboard full of Meta metrics does not automatically give you the full business picture.
Consider a lead generation campaign.
Meta reports:
- $20,000 ad spend
- 500 leads
- $40 cost per lead
- 2.8x ROAS
The CRM reports:
- 310 qualified leads
- 82 sales appointments
- 31 new customers
The finance system reports:
- $74,000 collected revenue
Now the client has a better question.
Which campaigns generated the customers and revenue?
Answering it requires more than a Meta Ads dashboard. It requires the advertising data and the business data to work together.
This is where a social media ads dashboard becomes more useful than a collection of platform reports.
The dashboard should connect the journey:
Ad spend → Leads → Qualified leads → Customers → Revenue
The goal is not to replace Meta Ads Manager. It is to give the client a clearer view of what the advertising activity means for the business.
What Should a Client-Ready Meta Ads Dashboard Show?
The best dashboard depends on the client’s goal.
For lead generation, start with:
- Ad spend
- Leads
- Cost per lead
- Qualified leads
- Cost per qualified lead
- Customers
- Revenue
For ecommerce, focus on:
- Ad spend
- Purchases
- Cost per purchase
- Revenue
- ROAS
- Average order value
- Conversion rate
For campaign analysis, add:
- Campaign performance
- Ad set performance
- Creative performance
- CTR
- CPC
- Conversion rate
- Period-over-period changes
The important part is the order.
Start with the business outcome.
Then show the metrics explaining the outcome.
For example:
Revenue → ROAS → Campaigns → Ad sets → Creatives
This gives the client a path from the result to the detail.
How Papercrane Turns Meta Ads Reporting Into a Live Dashboard
Papercrane connects Facebook Ads with other data sources, including Google Ads, LinkedIn Ads, Shopify, HubSpot, Google Analytics and more.
The workflow is simple.
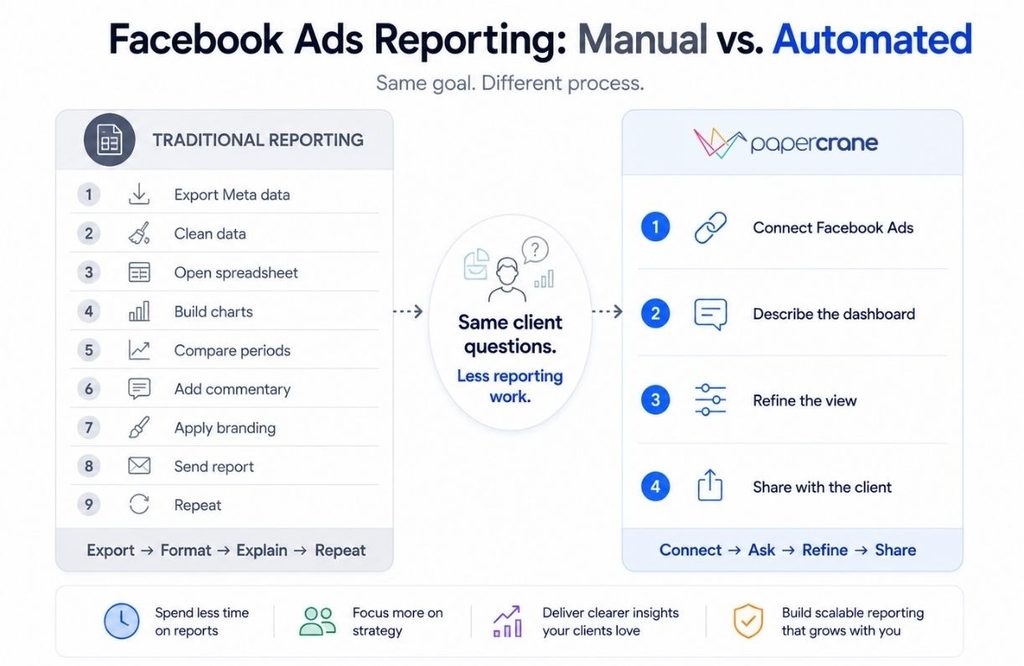
1. Connect
Connect the client’s Facebook Ads data.
2. Ask
Describe the dashboard you need in plain language.
For example:
“Build a client dashboard showing Meta ad spend, leads, CPL, ROAS and campaign performance for the last 30 days.”
3. Refine
Ask for changes without rebuilding the dashboard from scratch.
“Add month-over-month changes.”
“Show our five best campaigns.”
“Add revenue from Shopify.”
“Highlight campaigns where CPL increased.”
4. Share
Share the finished dashboard with the client.
Papercrane’s current workflow follows the same basic model. Connect your data, ask for the dashboard you need, then share it through a link.
For agencies, Papercrane also supports branded client-facing dashboards and multiple data sources across different client setups.
See how Papercrane works for agencies
What Changes When Reporting Runs This Way?
The biggest change is where your team spends its time.
Traditional workflow:
Export → Clean → Format → Compare → Write → Send → Repeat
Papercrane workflow:
Connect → Ask → Refine → Share
The difference becomes more useful when client requirements vary.
Imagine your agency manages three accounts.
Client A is a B2B company.
Their dashboard combines Meta Ads and HubSpot.
They need:
Leads → Qualified leads → Pipeline → Revenue
Client B is an ecommerce brand.
Their dashboard combines Meta Ads and Shopify.
They need:
Spend → Purchases → Revenue → ROAS
Client C is a lead generation company.
Their dashboard combines Meta Ads and a CRM.
They need:
Spend → Leads → Qualified leads → Cost per qualified lead
You do not need to force every client into the same Facebook Ads report template.
You build the dashboard around the client’s actual reporting question.
Papercrane’s agency content follows this same approach, with different dashboard structures for B2B, ecommerce and SEO reporting.
Three Client Questions Your Dashboard Should Answer
A useful Meta Ads dashboard should help you answer three levels of questions.
What happened?
“Spend increased 18% and leads increased 11%.”
Why did it happen?
“Campaign B produced most of the additional leads, but its cost per lead also increased.”
What should we look at next?
“Campaign C has lower spend but stronger lead quality. Compare its pipeline performance before increasing budget.”
This is where reporting becomes more valuable than a monthly collection of numbers.
The client gets context.
Your account manager gets a faster way to explain performance.
Your media buyer gets a clearer view of where to investigate.
How to Build a Client-Ready Facebook Ads Dashboard With Papercrane
You do not need to start with a finished dashboard template.
Start with the client’s reporting question.
- Connect Facebook Ads.
- Describe the KPIs and date range you need.
- Add another data source if the question crosses platforms.
- Ask for campaign, channel or period comparisons.
- Refine the dashboard based on the client’s reporting needs.
- Share the finished dashboard.
For example:
“Show Meta spend, leads, CPL and ROAS by campaign. Compare the last 30 days with the previous 30 days.”
Then:
“Add Shopify revenue and show ROAS based on actual revenue.”
The dashboard evolves around the question instead of forcing the question into a fixed report.
Connect your data sources with Papercrane
Facebook Ads Reporting FAQs
What should a Facebook Ads dashboard include?
Start with the metrics tied to the client’s goal. Common metrics include spend, impressions, clicks, leads, CP, CPA, ROAS, revenue and conversion rate.
What is the difference between Facebook Ads reporting and Meta Ads reporting?
Facebook Ads reporting often refers to advertising performance on Facebook. Meta Ads reporting covers the broader Meta advertising ecosystem, including Facebook and Instagram.
Is a Facebook Ads report template enough for client reporting?
A template works well when every client needs the same metrics. It becomes restrictive when clients need different KPIs or data from other systems.
How do agencies automate Meta Ads reporting?
Agencies typically connect advertising data to a reporting platform, create dashboards or templates, refresh the data and share reports with clients. Papercrane adds an AI-driven workflow where teams describe the dashboard they need and refine it through natural-language requests.
Can a Meta Ads dashboard include CRM or ecommerce data?
Yes, when the reporting platform supports those data sources. This gives agencies a view of advertising performance alongside leads, customers or revenue.
Stop Rebuilding the Same Meta Ads Report
Your clients do not need another spreadsheet full of advertising metrics.
They need answers.
Which campaigns worked?
Why did performance change?
Which leads became customers?
Where did the revenue come from?
What deserves attention next?
A client-ready Facebook Ads dashboard should bring those answers into one place and pricing of Papercrane is also affordable.
With Papercrane, you connect the data, describe the dashboard, refine it as requirements change and share it with the client.