Dashboard Software Pricing 2026: Hidden Costs Exposed
July 28, 2026
·
Tim Liu
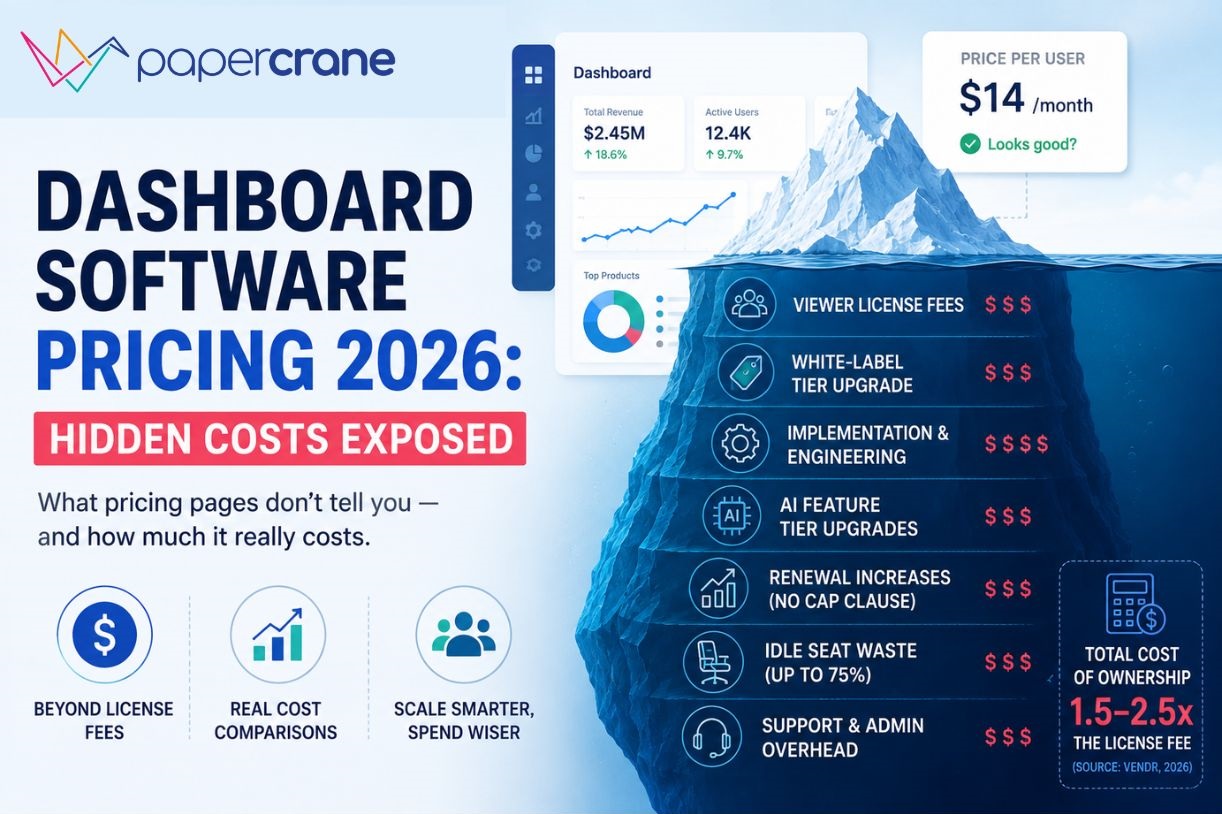
A CFO signed a Tableau contract. The plan looked reasonable, a manageable per-user number.
Six months in, between implementation consulting, data prep, training, and the support tier he didn’t know was optional, his team had spent well over what the license alone implied.
Seventy-five percent of his employees still used Excel.
That story isn’t an outlier. It’s the standard arc for business intelligence pricing in 2026.
The gap between what dashboard software says it costs and what it actually costs is one of the most consistently underestimated line items in a modern tech budget.
Why BI Pricing Is So Hard to Decode in 2026
You’re no longer choosing between “cheap” and “expensive”, you’re navigating six incompatible models: per-seat, per-capacity, MAU-based, consumption credits, flat-rate, and hybrid.
A tool that looks affordable on the pricing page can cost 3x more once you factor in viewers, white-labeling, and AI add-ons.
Two events in 2025 made this worse. First, Microsoft raised Power BI Pro from $10 to $14 per user per month, a 40% hike applied to existing customers at renewal, with minimal warning.
Second, AI features became the headline marketing claim for every BI vendor, but almost universally those features are gated behind premium tiers that cost multiples of the base plan.
The median cheapest monthly BI plan across the market is $49. The average is $379, pulled upward dramatically by a handful of enterprise-first products.
The 5 Hidden Costs Nobody Puts on Their Pricing Page
1. Viewer and User License Fees
Most platforms charge depending on what users do, build dashboards vs. view them vs. explore data. The split sounds reasonable until you model it for a real team.
For embedded analytics, dashboards inside your own SaaS product for customers, the problem is sharper.
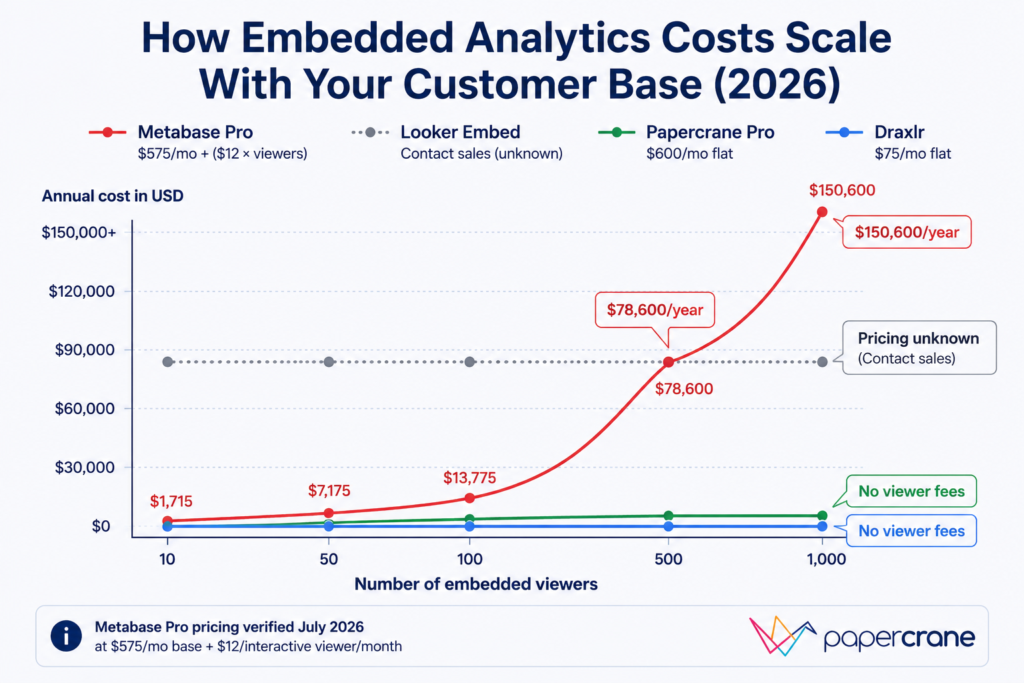
Metabase Pro (verified July 2026) charges $575/month base plus $12/month per interactive viewer.
Five hundred customers viewing your embedded dashboard means $6,000/month in viewer fees on top of the base plan, $78,600/year before a single implementation dollar is spent.
The rule: always model the cost at your current user count and at 2x and 5x that count before signing.
2. White-Label Fees
If you need to embed dashboards in your product without another company’s logo on it, you need white-labeling. Almost every vendor offers it, at a much higher tier than their entry price.
Always ask “what tier includes white-labeling?” before evaluating any other feature, especially for customer-facing use cases. Jumping tiers for white-label access alone commonly doubles or triples the contract value.
3. Implementation Costs
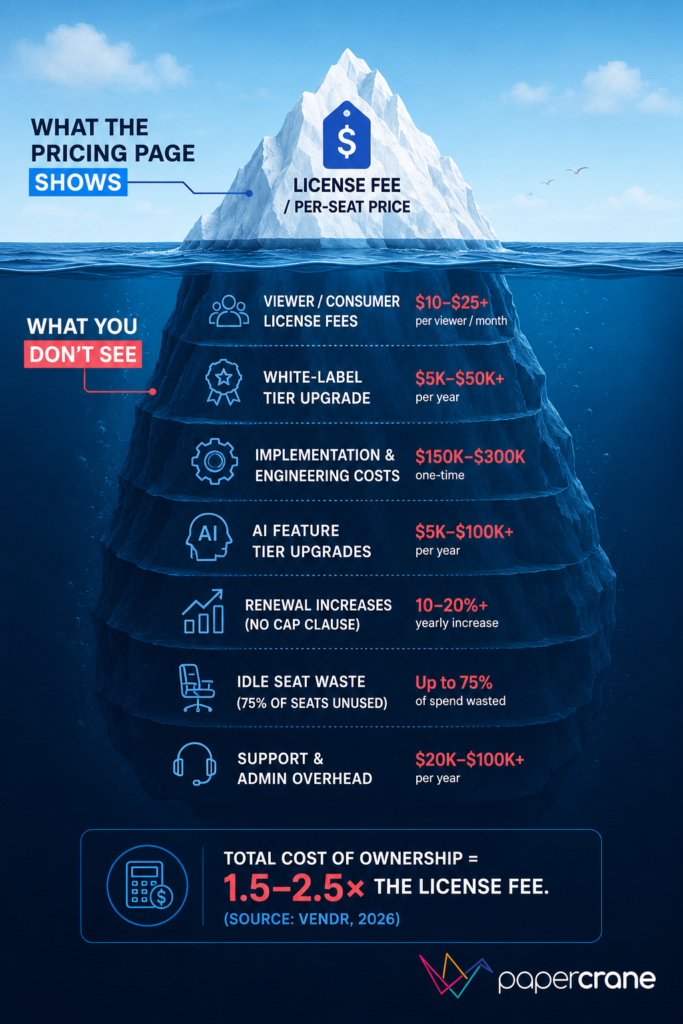
Vendors rarely mention this, but Vendr’s procurement data across BI platforms consistently shows total cost of ownership runs 1.5 to 2.5x the annual license fee when you include implementation, infrastructure setup, training, and ongoing administration.
For embedded analytics platforms specifically, engineering infrastructure, multi-tenancy, row-level security, and governance, commonly adds $150,000 to $300,000 in first-year costs that never appear on the pricing page.
Forrester’s research estimates up to 80% of IT budget gets consumed by maintenance costs after the initial build, leaving only 20% for new capability.
The 29% of teams who built in-house analytics regretted it within one year. The math explains why.
4. AI Features That Require a Full Tier Upgrade
Every BI vendor’s homepage leads with AI in 2026. Almost none include meaningful AI in their base plan.
- Power BI Copilot: Requires Fabric capacity, not available on the $14/user Pro plan. The entry-level Fabric F64 tier that eliminates per-user viewer licenses costs approximately $8,410/month pay-as-you-go or $4,982/month on a 1-year reservation (verified July 2026, US region)
- Tableau Agent and Pulse: Included from Standard tier, but agentic capabilities (Tableau Next) require the Tableau+ Bundle, contact sales only.
- Metabase Metabot AI: Add-on at $100/month for 500 requests, not included in base plans
The pattern is consistent: AI is the headline feature, but the useful version is always further up the pricing ladder.
5. Renewal Increases and Multi-Year Lock-In
Tableau requires annual contracts, no month-to-month option exists. Documented cases show support fees jumping significantly at renewal, and there is no standard renewal cap in base agreements.
Power BI pricing comparison in April 2025 was applied to existing contracts at renewal. Domo customers have reported renewal increases in the hundreds of percent.
These aren’t edge cases, they’re standard commercial behavior from large BI vendors operating in a market where switching costs are high.
Business Intelligence Pricing by Tool
Microsoft Power BI
| Plan | Monthly Cost |
|---|---|
| Desktop | Free (Windows only) |
| Pro | $14/user/month (raised 40% from $10 in April 2025) |
| Premium Per User (PPU) | $24/user/month |
| Fabric F64 (pay-as-you-go) | $8,410/month (eliminates viewer licenses at this tier and above) |
| Fabric F64 (1-year reserved) | $4,982/month (41% savings vs. pay-as-you-go) |
Source: Microsoft Power BI official blog (November 2024), Solv Systems Fabric pricing guide (July 2026)
Reality check: Power BI Pro looks affordable at $14/user/month until you need AI features (Fabric), white-labeling (Fabric), or to eliminate viewer licensing at scale (requires F64 or above).
The $14/user plan is a reporting tool, not a full analytics platform pricing.
Best for: Microsoft-stack organizations (M365, Azure, Dynamics) with dedicated BI talent who don’t need embedded analytics.
Tableau
| Plan | Starting Price | Notes |
|---|---|---|
| Tableau Standard (Cloud or Server) | $15/user/month | Annual only; includes Tableau Pulse |
| Tableau Enterprise (Cloud or Server) | $35/user/month | Annual only; Advanced Management included |
| Tableau Cloud+ / Server+ | Contact sales | Includes Tableau Agent, Premier Success |
| Tableau Next | $40/user/month | Agentic analytics; Salesforce CRM integration |
| Tableau+ Bundle | Contact sales | Cloud + Next combined |
Source: tableau.com/pricing, verified July 21, 2026
Important context: Tableau pricing comparison is restructured now. The $15/user/month Standard price is the published entry point, actual costs depend on user mix (Creator, Explorer, Viewer roles), deployment type (Cloud vs. Server), and whether you need AI/agentic features. All plans are annual only with no month-to-month option.
Best for: Enterprise teams where visualization depth and governance are the primary requirements and budget allows for the full implementation investment.
Looker (Google Cloud)
Looker publishes no public pricing, all three editions (Standard, Enterprise, Embed) list “Call Sales / Annual commitment” on the official Google Cloud pricing page (verified July 2026).
Widely cited market estimates put enterprise contracts in the range of $60,000-$300,000/year depending on user count and edition, but these are not verifiable from published sources. Always get a direct quote before budgeting.
Best for: Organizations deeply invested in Google Cloud / BigQuery with dedicated data engineering teams.
Metabase
| Plan | Monthly Cost | Notes |
|---|---|---|
| Open Source | Free | Self-hosted; community support only |
| Cloud Starter | $100/month + $6/user/month (first 5 included) | Basic cloud hosting |
| Cloud Pro | $575/month + $12/user/month (first 10 included) | SSO, white-label, embedded analytics |
| Enterprise | From $20,000/year | Custom; dedicated support, compliance |
Source: metabase.com/pricing, verified April 2026 across multiple independent sources
The embedded trap: Every interactive viewer in Metabase Pro, including your customers accessing embedded dashboards, counts as a paid seat at $12/month. There is no separate cheaper viewer tier. For SaaS teams with hundreds of customers, this compounds fast.
Internal BI vs. Embedded Analytics: Two Very Different Pricing Worlds
This distinction trips up more buyers than any other. Internal BI means dashboards for your own employees. Embedded analytics means dashboards inside your product, visible to your customers.
The tools and pricing models are fundamentally different:
- Internal BI (Power BI, Tableau, Looker): priced per internal seat, built for analysts and executives
- Embedded analytics (Metabase Embedded, Sisense, Draxlr, Papercrane): built for multi-tenancy, white-labeling, and external viewer scale
The trap: companies start with an internal BI tool pricing comparison because it’s cheaper upfront, then try to embed it for customers, and discover it’s either technically impossible or commercially prohibitive at their tier. Always answer “will my customers ever see this dashboard?” before choosing a tool category.
Explore the full breakdown of embedded analytics use cases and real-world examples →
Real Cost Scenarios: What 3 Types of Teams Actually Pay
Small Team: 10 Users, Internal Analytics
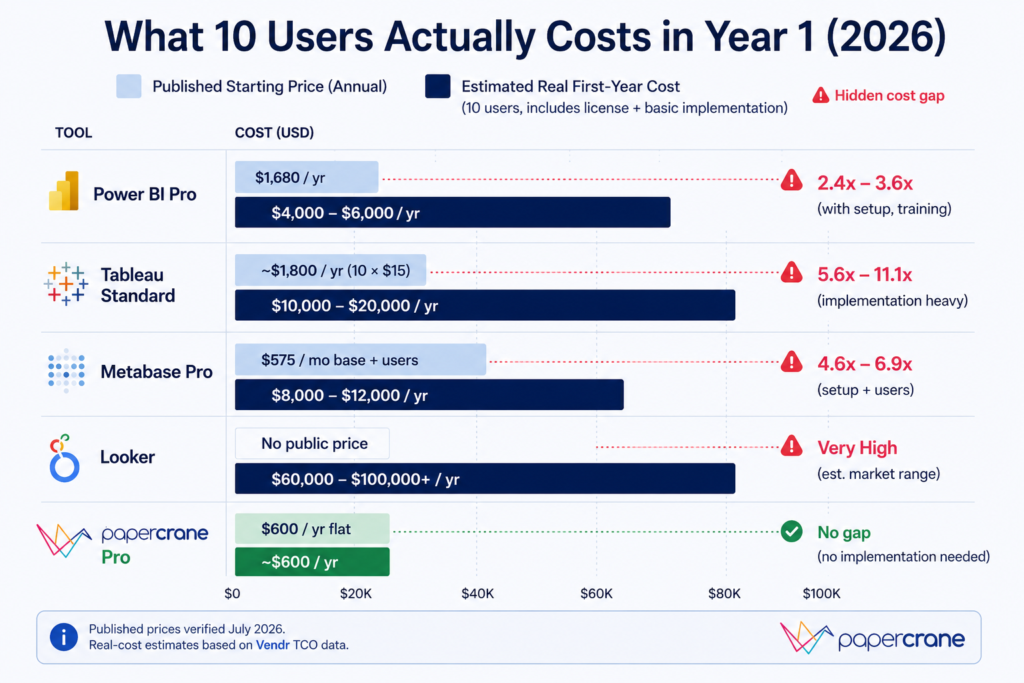
| Tool | Estimated Annual Cost | Notes |
|---|---|---|
| Papercrane Pro | $600/year | Flat team rate, no per-seat |
| Power BI Pro | $1,680/year | 10 × $14/month |
| Metabase Starter | $1,920/year | $100 base + 10 × $6 |
| Tableau Standard | Custom (contact sales for exact mix) | $15/user/month starting point; actual depends on user role mix |
| Looker | Contact sales | No published pricing |
Mid-Market: 50 Users, Mix of Roles, Internal Analytics
| Tool | License Cost/Year | With TCO (1.5-2.5×) |
|---|---|---|
| Power BI Pro | $8,400/year | $12,600–$21,000 |
| Tableau | Contact sales for exact quote | Significantly higher with implementation |
| Looker | Contact sales | No published benchmark |
Vendr’s procurement data shows BI total cost of ownership consistently runs 1.5–2.5× the annual license fee when implementation, infrastructure, and administration are included.
SaaS Builder: 500 Customers, Embedded Analytics with White-Label
| Tool | Annual Cost | Notes |
|---|---|---|
| Metabase Pro | $78,600/year | $575 base + 500 × $12/month viewer fees |
| Power BI Embedded | Contact sales (Fabric F SKU) | Engineering costs add $150K–$300K |
| Looker Embed | Contact sales | No public pricing |
| Draxlr | $900/year | Flat rate, unlimited viewers, white-label included |
What looks like a manageable license turns into a per-viewer fee compounding machine as your customer base grows.
Traditional BI vs. AI Dashboard Builders: The Pricing Model Shift
Traditional BI pricing was designed for a world where SQL expertise was rare and dashboards were precious deliverables. That’s why it charged per seat, demanded annual commitments, and gated AI behind the most expensive tier.
AI-native dashboard builders were designed for a different assumption: any team member should be able to ask a question and get a dashboard in minutes. The pricing models reflect that.
With tools like Papercrane, you connect your data sources once, BigQuery, Snowflake, PostgreSQL, MongoDB, spreadsheets, GA4, and 50+ more.
No SQL. No data modeling project. No $150,000 implementation. See how AI dashboard builders work without SQL →
The pricing difference is structural, not just numerical:
- Traditional BI: charges per licensed seat, whether used or not. Industry research (BARC/Eckerson Group) shows only around 25% of employees actively use the BI tools their companies pay for, meaning 75% of per-seat costs are often wasted
- AI dashboard builders: flat team pricing or usage-based credits, you pay for dashboards built, not seats provisioned
Papercrane’s pricing reflects this: free to start with no credit card required, Pro at $50/month flat for small teams with no per-viewer fees.
Share dashboards with anyone, no Papercrane account required, no viewer license to purchase. See the full pricing breakdown →
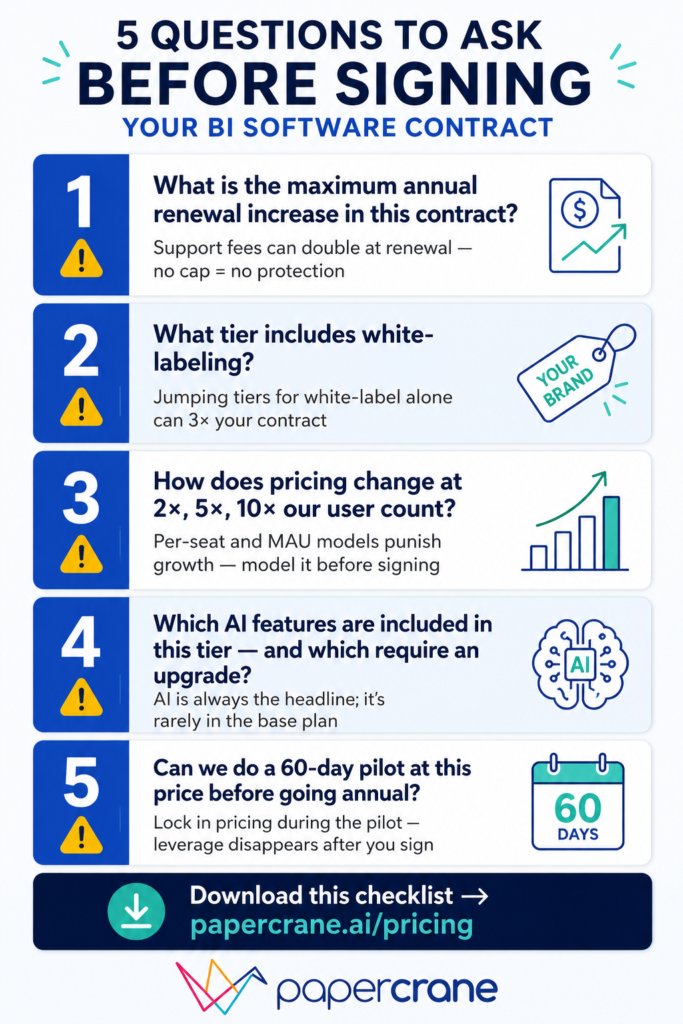
5 Questions to Ask Every BI Vendor Before Signing
No competitor covers negotiation tactics. These five questions will save you from the most common contract surprises:
- “What is the maximum annual renewal increase in this contract?” If there’s no cap, support and license fees can increase sharply. Ask for a capped percentage in writing.
- “What tier includes white-labeling?” Get the answer before evaluating any other feature, especially for embedded use cases.
- “How does pricing change when we reach 2×, 5×, 10× our current user count?” Per-seat and MAU-based models penalize growth. Model it before you sign.
- “Which AI features are included in this tier, and which require an upgrade?” Every vendor will claim they have AI. Ask which plan those features actually live in.
- “Can we do a 60-day pilot at this price before committing to annual?” Most enterprise vendors will agree. Lock in the pricing during the pilot before scaling.
FAQs
How much does business intelligence software cost in 2026?
Business intelligence software ranges from free open-source tools to enterprise platforms costing hundreds of thousands annually. Pricing typically starts around $14/user/month, but total ownership costs often exceed licence fees.
Why did Power BI pricing increase in 2025?
Microsoft increased Power BI Pro pricing from $10 to $14 per user/month in April 2025, with Premium Per User rising to $24/month. It was the platform’s first pricing update since 2015.
What is embedded analytics pricing in 2026?
Embedded analytics pricing varies by platform. Many charge per interactive viewer, while flat-rate and AI-native solutions offer predictable pricing without viewer fees. Always confirm whether white-labeling is included.
Is there a dashboard tool without viewer licensing fees?
Yes. AI-native dashboard builders like PaperCrane and flat-rate platforms such as Draxlr don’t charge per-viewer licensing fees, making them more cost-effective for embedded analytics at scale.
What is the total cost of ownership for a BI implementation?
BI implementation costs extend beyond software licences. According to Vendr, total cost of ownership is typically 1.5–2.5× annual licensing after implementation, infrastructure, training, and ongoing administration are included.
Build Smarter Dashboards with PaperCrane
Dashboard software pricing in 2026 is not what the pricing page says it is.
For teams evaluating traditional BI tools: go in knowing the TCO formula, ask the five questions above before signing, and always model what costs look like at 2× and 5× your current user count.
For teams questioning whether the traditional BI model makes sense at all: the AI-native alternatives have matured enough in 2026 that the comparison is worth making honestly.
Flat pricing, no viewer fees, no SQL required, and no six-figure implementation project is a meaningfully different value proposition.
Papercrane’s pricing page takes two minutes to read. Free to start, no credit card, no sales call required.