Businesses are generating more data than ever before. And the challenge is not collecting it. The challenge is making data available where people need it.
Many organizations still rely on separate business intelligence tools and reporting platforms. Users must leave the application they are working in, log in to another system, find the correct dashboard, and then return to their workflow.
This method used to work, but in 2020! Today, embedded analytics has solved this problem by integrating dashboards, reports, and insights directly into the applications people already use. You can get anything built online within seconds, whether a SaaS platform, performance metrics, an e-commerce store, tracking trends, or even campaign reports for agencies.
What Is Embedded Analytics?
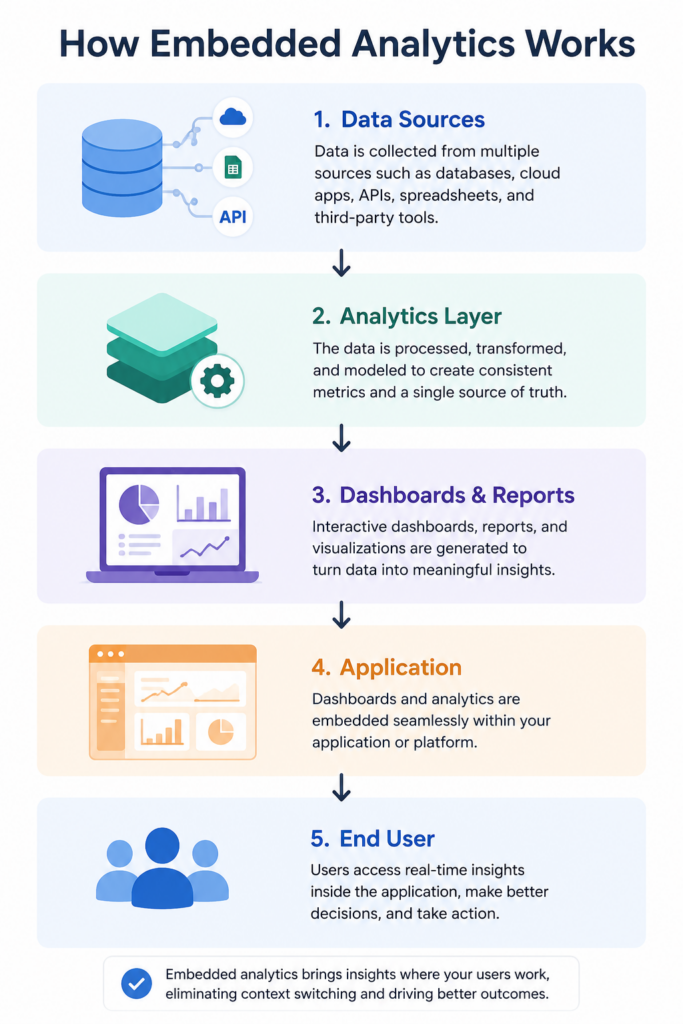
Embedded analytics is the integration of dashboards, reports, charts, and data visualizations directly within an application, allowing users to access insights without leaving the software they use every day.
Embedded Analytics vs Embedded BI
Embedded BI, or embedded business intelligence, refers to the broader practice of integrating business intelligence capabilities into software applications.
Embedded analytics is the implementation of that concept through dashboards, reporting tools, charts, and interactive visualizations.
Why Businesses Use Embedded Analytics
Who doesn’t want faster access to insights? It’s too boring now to wait for analysis to finish, reporting, and switching between multiple tools to make a decision.
Embedded analytics helps businesses:
- Reduce reporting friction
- Improve user experience
- Increase product adoption
- Deliver self-service analytics
- Provide real-time visibility into performance
- Help users make data-driven decisions
As more companies invest in AI-powered analytics and no-code reporting tools, embedded analytics is becoming a standard feature rather than a competitive advantage.
Here’s an example:
Imagine a marketing agency managing campaigns for multiple clients. Without embedded analytics:
- The client requests a performance update.
- The agency exports reports from multiple platforms.
- The team manually builds a dashboard.
- The report is shared as a PDF or spreadsheet.
With embedded analytics:
- Campaign data flows into a dashboard automatically.
- The dashboard is embedded in a client portal.
- Clients access real-time performance data whenever they need it.
The result is faster reporting, fewer manual tasks, and greater transparency.
Who Should Use Embedded Analytics?
If your company wants to make the data easier to access and utilize, you need it.
While it is commonly associated with SaaS products, many industries benefit from embedding analytics directly into workflows.
SaaS Companies
It provides a customer-facing dashboard. Instead of asking customers to connect separate reporting tools, analytics become part of the product experience.
Common examples include:
- Product usage dashboards
- Revenue tracking
- Customer engagement metrics
- Subscription analytics
This improves customer retention and increases product value.
Marketing Agencies
Marketing agencies handle large amounts of campaign data across platforms such as Google Ads, Meta Ads, LinkedIn, and GA4.
Embedded analytics allows agencies to provide clients with live reporting dashboards instead of sending static reports.
Benefits include:
- Reduced reporting time
- Better client experience
- Greater transparency
- Real-time campaign visibility
Product Teams
Product managers rely on analytics to understand user behavior and product performance. Embedded analytics helps product teams monitor:
- Feature adoption
- User engagement
- Retention metrics
- Product usage trends
Customer Success Teams
Customer success teams need visibility into account health and customer activity. Embedded dashboards make it easier to identify:
- At-risk customers
- Product adoption trends
- Usage declines
- Expansion opportunities
Finance Teams
Real-time visibility helps finance leaders make faster and more informed decisions. Finance teams use embedded analytics to monitor:
- Revenue
- Expenses
- Profitability
- Forecasts
- Cash flow
E-commerce Businesses
Embedded analytics helps centralize this information in a single view, making it easier to manage operations and growth. E-commerce brands often need insights across:
- Sales performance
- Inventory levels
- Customer behavior
- Marketing performance
Top Benefits of Embedded Analytics
Embedded analytics helps organizations make data more accessible, improve user experience, and reduce reporting effort.
Better User Experience
Users no longer need to switch between multiple platforms to find information.
They can:
- View dashboards
- Track KPIs
- Monitor performance
- Take action immediately
This creates a smoother experience and increases engagement.
Faster Decision-Making
When insights are available where work happens, decisions happen faster.
Teams no longer need to:
- Request reports
- Export spreadsheets
- Wait for analysts
Real-time visibility allows businesses to identify opportunities and solve problems sooner.
Increased Product Adoption
For SaaS companies, analytics often becomes one of the most valuable product features.
Customers who regularly use dashboards are more likely to engage with the platform, understand their results, and continue using the product.
Reduced Reporting Bottlenecks
Traditional reporting often depends on analysts and technical teams.
Embedded analytics supports self-service reporting, allowing users to access information themselves.
This reduces repetitive reporting requests and frees up internal resources.
Improved Customer Retention
Customers stay longer when they can clearly see value.
Dashboards that track usage, performance, revenue, or outcomes help customers understand results and remain engaged.
Key Features of Modern Embedded Analytics Platforms
Not all embedded analytics software offers the same capabilities. The best platforms make analytics easy to access, easy to share, and easy to understand.
When evaluating an embedded analytics platform, look for these key features.
Interactive Dashboards
Users should be able to explore data instead of viewing static reports.
Interactive dashboards allow users to:
- Filter data
- Change date ranges
- Compare metrics
- Drill down into details
This makes analytics more useful and actionable.
Real-Time Reporting
Business decisions are more effective when based on current data.
Real-time reporting helps teams monitor:
- Revenue
- Product usage
- Campaign performance
- Customer activity
Without waiting for scheduled reports.
Role-Based Access
Not every user should see the same data.
Role-based permissions help organizations control access, improve security, and ensure the right information reaches the right people.
White-Label Analytics
Many SaaS companies and agencies want analytics to match their own brand.
White-label analytics allows businesses to customize dashboards with their logo, colors, and branding.
AI-Powered Insights
AI is changing how analytics works.
Modern platforms can:
- Generate dashboards automatically
- Surface trends and anomalies
- Answer questions in natural language
- Reduce dependence on SQL and technical teams
This makes analytics accessible to a much wider audience.
Embedded Analytics vs Traditional Business Intelligence
Both embedded analytics and traditional business intelligence help organizations understand data. The difference is in where users access insights.
| Feature | Embedded Analytics | Traditional BI |
| Access | Inside the application | Separate platform |
| User Experience | Seamless | Requires switching tools |
| Adoption | Higher | Lower |
| Learning Curve | Lower | Higher |
| Time to Insight | Faster | Slower |
| Self-Service Analytics | Easier | Often requires training |
For many organizations, embedded analytics creates a better experience because users receive information exactly where they work.
Embedded Analytics Examples
The best way to understand embedded analytics is through practical examples.
SaaS Dashboard
A project management platform can display team productivity, project progress, and usage trends directly inside the product.
Users never need to leave the platform to understand performance.
Marketing Reporting Portal
A marketing agency can provide clients with live dashboards showing:
- Ad spend
- Leads
- Conversions
- Return on ad spend (ROAS)
Instead of sending weekly reports.
E-commerce Analytics Dashboard
An online store can monitor:
- Sales performance
- Inventory levels
- Customer behavior
- Revenue trends
From a single dashboard.
In each case, analytics becomes part of the workflow instead of a separate task.
How Papercrane Simplifies Embedded Analytics
Traditional analytics projects often require developers, analysts, SQL knowledge, and weeks of setup.
Papercrane takes a different approach.
Instead of manually building dashboards, users connect their data and describe what they want to see.
Papercrane uses AI to generate dashboards and reports through natural language prompts.
Teams can:
- Build dashboards without SQL
- Connect multiple data sources
- Create reports faster
- Share dashboards through simple links
- Deliver embedded analytics experiences with less effort
This allows businesses to focus on making decisions instead of building reporting infrastructure.
Whether you are creating customer-facing dashboards, internal analytics portals, or executive reporting views, Papercrane helps reduce complexity while making data easier to access.
Frequently Asked Questions
What is embedded analytics?
Embedded analytics is the integration of dashboards, reports, and visualizations directly into an application so users can access insights without leaving the software they are using.
What is the difference between embedded analytics and business intelligence?
Business intelligence is the broader practice of analyzing data. Embedded analytics delivers those insights directly inside applications and workflows.
What are the benefits of embedded analytics?
The main benefits include faster decision-making, improved user experience, reduced reporting effort, higher product adoption, and better customer retention.
Which industries use embedded analytics?
SaaS companies, marketing agencies, ecommerce businesses, finance teams, product teams, and customer success teams commonly use embedded analytics.
How does AI improve embedded analytics?
AI can generate dashboards automatically, identify trends, answer questions in plain English, and reduce the technical work required to build reports.
Key Takeaways
- Embedded analytics brings dashboards and insights directly into applications.
- Users can access data without switching between tools.
- Businesses benefit from better user experiences, faster decisions, and reduced reporting effort.
- AI-powered analytics makes dashboard creation faster and more accessible.
- Embedded analytics is becoming a core feature for modern software products.
Build Embedded Analytics Without Complex BI Workflows
Embedded analytics helps organizations deliver insights where work happens.
With Papercrane, you can connect your data, generate dashboards using AI, and share analytics without the complexity of traditional business intelligence tools.
Start building dashboards faster and give your users access to the insights they need, exactly when they need them.